Figures & data
Table 2 Caloric intake and body weight of rats under the effect of P. karwinskii extracts after 13 days of experimental treatment.
Table 1 Antioxidant capacity of Prosthechea karwinskii extracts.
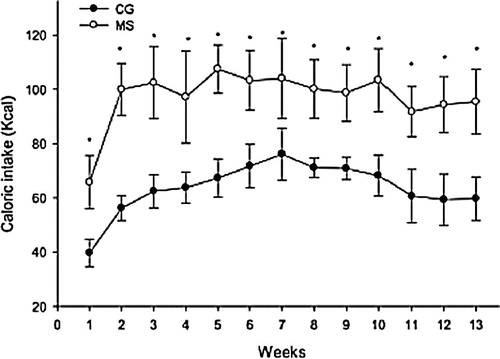
Fig. 1 Caloric intake during Metabolic Syndrome development. CG: control group, MS: sucrose diet, kcal: kilocalories. The values represent the mean ± DS ∗P < 0.05.