
Figures & data
Table 1 Total phenolics, tannins and flavonoids content of S. mundagam leaf and bark.
Table 2 Activity of S. mundagam leaf and bark in ABTS+, FRAP and phosphomolybdenum assays.
Fig. 1 DPPH radical scavenging activity of S. mundagam leaf and bark. IC50 – Inhibitory concentration 50%.
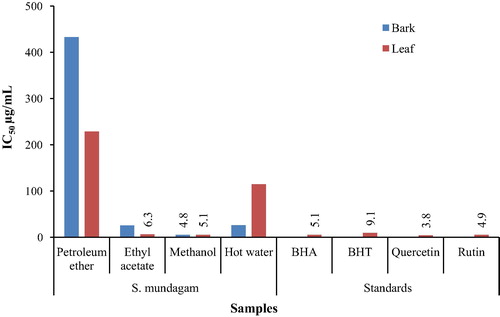
Fig. 2 Metal chelating activity of S. mundagam leaf and bark. Values are mean of triplicate determination (n = 3) ± standard deviation. a > b, where significance among the extracts at p < 0.05.

Fig. 3 Superoxide radical scavenging activity of S. mundagam leaf and bark. Values are mean of triplicate determination (n = 3) ± standard deviation. a > b, where significance among the extracts at p < 0.05.
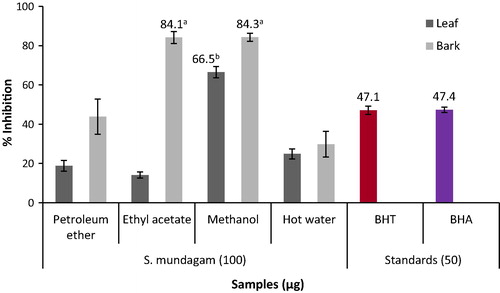
Fig. 4 Nitric oxide radical scavenging activity of S. mundagam leaf and bark. Values are mean of triplicate determination (n = 3) ± standard deviation. a > b, where significance among the extracts at p < 0.05.

Fig. 5 Oral glucose tolerance of S. mundagam bark methanol extract. The data represents mean ± SEM (n = 6). Significantly different at ***p < 0.001, when compared to control. SMBM- S. mundagam bark methanol extract.

Fig. 6 Antihyperglycemic activity of S. mundagam bark methanol extract. The data represents mean ± SEM (n = 6). Significantly different at *p < 0.05, **p < 0.01, ***p < 0.001, when compared to control. SMBM- S. mundagam bark methanol extract.
