Figures & data
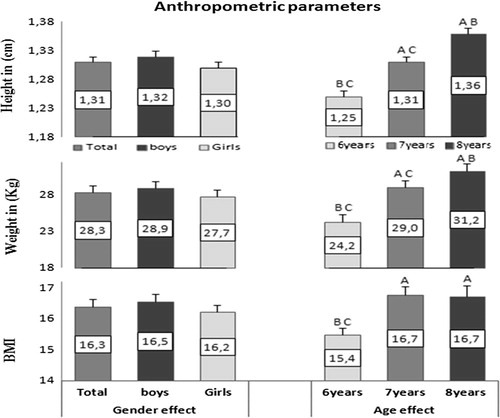
Figure 1 Anthropometric children’s parameters (i.e. Height in (cm), Weight in (kg) and BMI). Analyses were adjusted by sex (i.e. total, boys and girls) and age (i.e. 6, 7 and 8 years old). A, B and C represents significant difference between different ages (i.e. compared to 6, 7 and 8 years old respectively) with p < 0.05. Values are represented as mean ± SD.