Figures & data
Fig. 2 Comparison between the different groups according to Dopamine HPLC (ng/mg tissue).
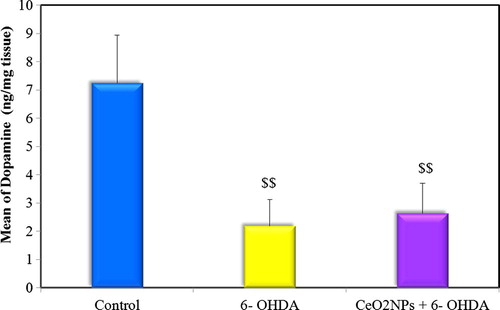
Fig. 3 Comparison between the different groups according to TAC (mM/mg protein).
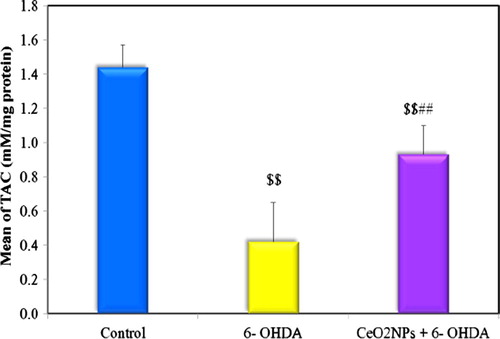
Fig. 4 Comparison between the different groups according to MDA (nM/g tissue).
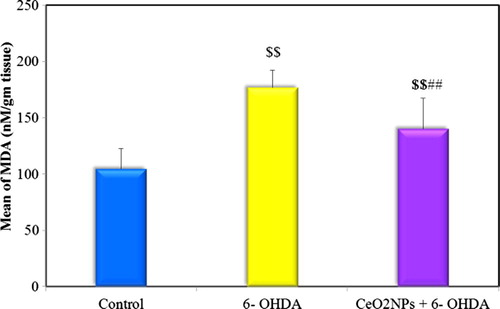
Fig. 5 Comparison between the different groups according to Nitrite (μM/mg protein).
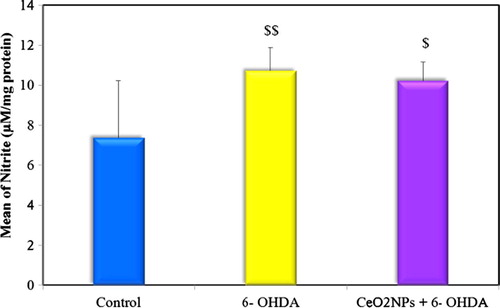
Fig. 7 Correlations between dopamine levels, oxidative stress markers (TAC, MDA & Nitrite) and caspase 3 measured in striatal tissue of all studied groups.
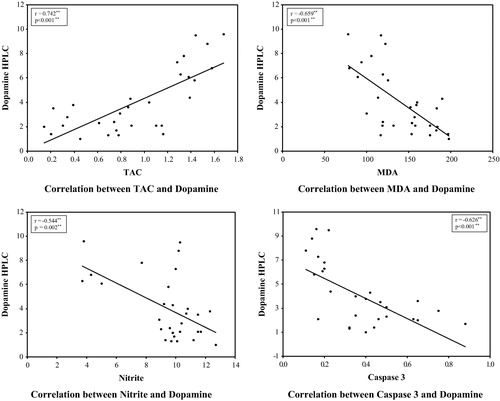
Table 1 Neuro-behavior finding in control, 6-OHDA untreated and preventive groups 3 weeks after intrasrtiatal injection of 6-OHDA.
Table 2 Neuro-behavior findings in control, 6-OHDA untreated group and preventive group 6 weeks after intrastriatal injection of 6-OHDA.
Table 3 Neuro-behavior findings in the preventive group 3 and 6 weeks after intrastriatal injection of 6-OHDA.
Fig. 1 Open field parameters: (A) latency to move (seconds), (B) number of crossed squares (C) latency to rear and (D) number of rears, three weeks following intrastriatal injection 6-OHDA injection. Data are expressed as medians (intra-quartile rang), $ P ⩽ 0.05, $$ P ⩽ 0.001versus control group, # P ⩽ 0.05, ## P ⩽ 0.001 versus 6-OHDAgroup.
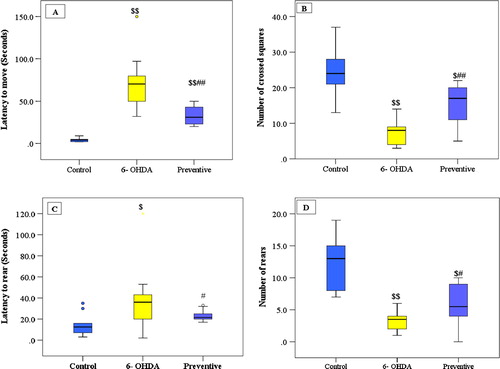
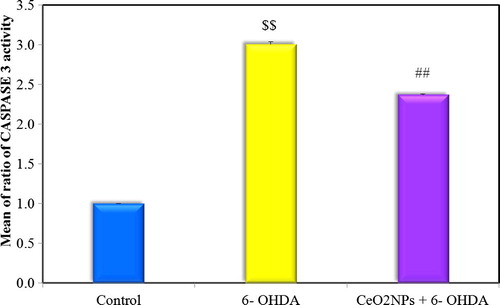
Fig. 6 Comparison between the different studied groups according to ratio of CASPASE 3 activity.