Figures & data
Table 1 Cases diagnosed in BMA and BMB.
Fig. 1 Pie chart showing age distribution.
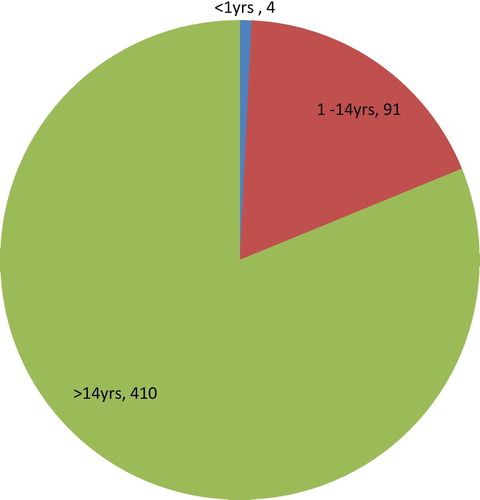
Fig. 2 BMA showing hypocellular marrow, H&E (10 × 10).
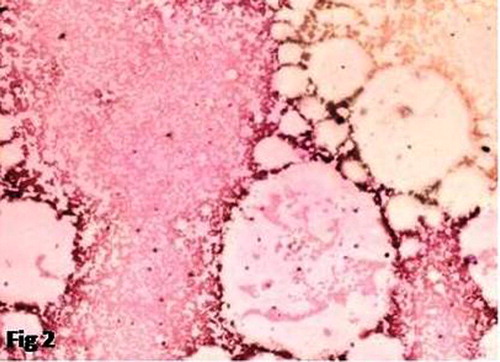
Fig. 3 BMB confirming aplastic anemia H&E (10 × 10).
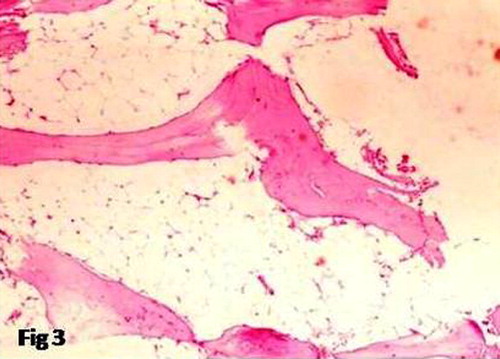
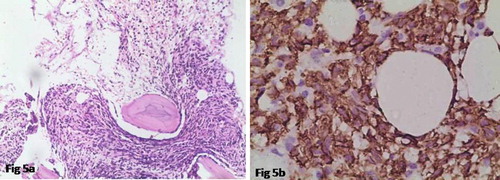
Fig. 4 (a) BMB showing hypocellularity & Fibrosis, H&E (10 × 10), (b) 40 × 10, yellow arrow-bizarre megakaryocytes, blue arrow-fibrosis, (c) 10 × 10 increased reticulin fibrosis of myelofibrosis.
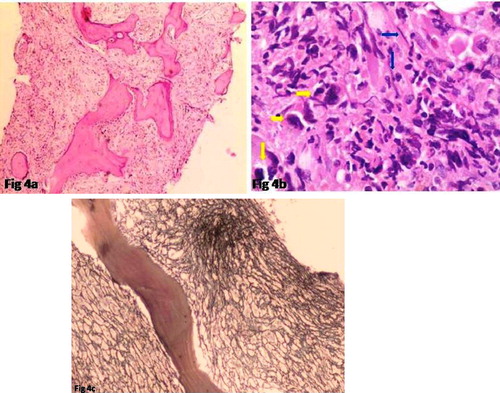
Fig. 5 (a) 10 × 10 small cell lymphoma involving marrow, (b) 40 × 10 I.H.C.-lymphoma involving marrow, CD20 +ve.