Figures & data
Fig. 1 ADC map demonstrates measurements of ADC value of the liver and that of the spleen.
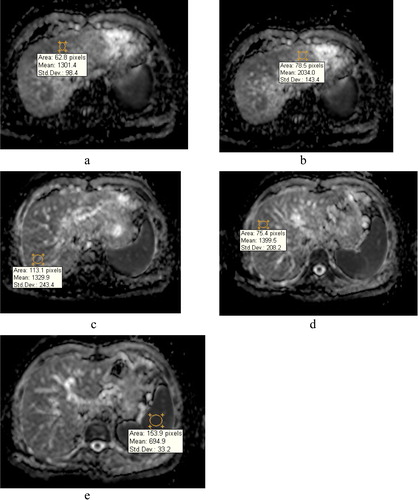
Table 1 Characteristic features of the studied groups.
Table 2 Comparison between the two studied groups regarding the laboratory and DWI findings.
Table 3 Results of liver biopsy of the studied patients.
Table 4 Relation between mean ADC (liver) and ADC (spleen) and stage of liver fibrosis.
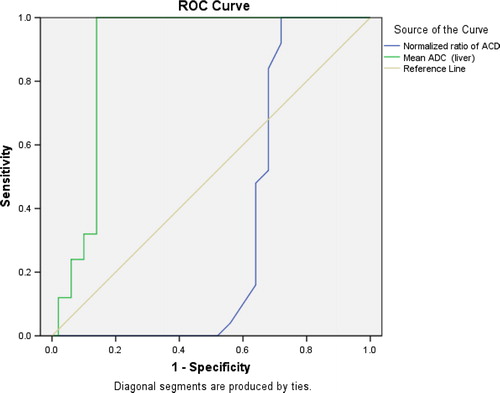
Fig. 2 ROC curve and the cut off value of both mean ADC liver and normalized ADC in detecting the stage of liver fibrosis.