Figures & data
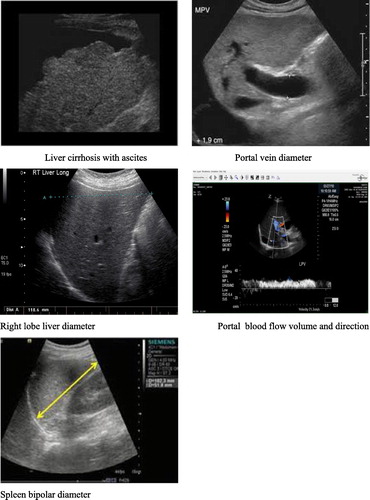
Table 1 Comparison between the different studied groups according to demographic data.
Table 2 Comparison between the three studied groups according to etiology of liver cirrhosis and fibrosis.
Table 3 Comparison between the three studied groups according to Local abdominal examination.
Table 4 Comparison between the different studied groups according to Child-Pugh classification.
Table 5 Comparison between the different studied groups according to lab investigations.
Table 6 Comparison between the different studied groups according to liver profiles.
Table 7 Comparison between the different studied groups according to prothrombin activity, prothrombin time and INR.
Table 8 Comparison between the studied groups according to ultra-sonographic data.
Table 9 Comparison between the different studied groups according to predictive scores.
Fig. 1 Comparison between the different studied groups according to serum soluble CD163.
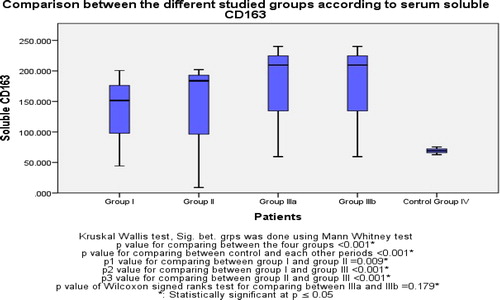
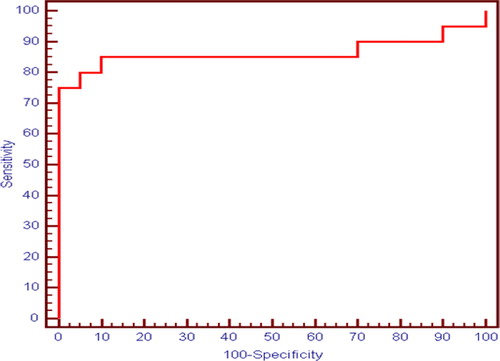
Fig. 2 ROC curve for Soluble CD163, HOMA IR and Platelets to predict presence of oesophageal varices between (Group II + Group IIIa) vs Group I.
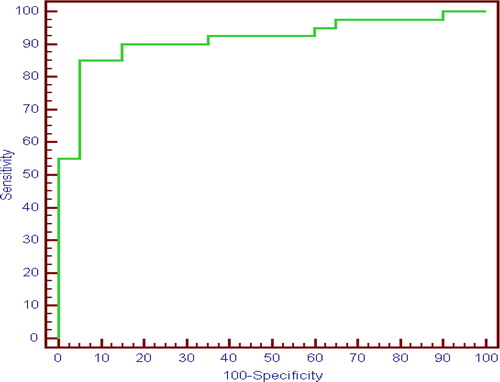
Fig. 3 ROC curve for Soluble CD163 to differentiate small oesophageal varices from large oesophageal varices (Group IIIa vs Group II).