Figures & data
Fig. 1 Time course effect of Alloxan on blood glucose level of rat.
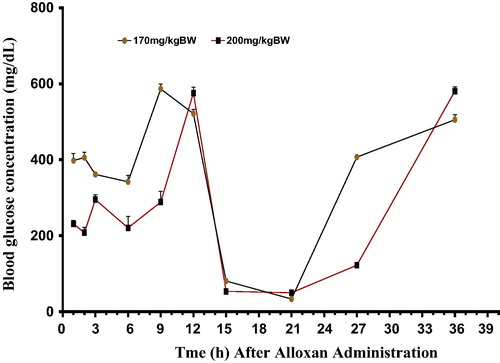
Fig. 2 Time course effect of Alloxan on Catalase (CAT) activity in the pancreas of rat.
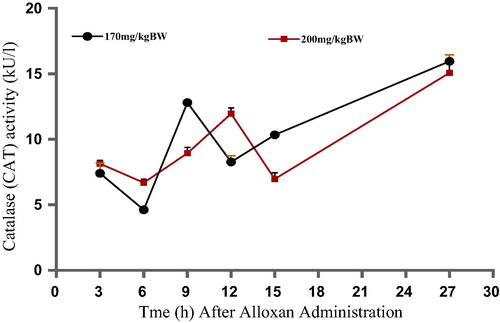
Fig. 3 Time course effect of Alloxan on Superoxide dismutase (SOD) activity in the pancreas of rat.
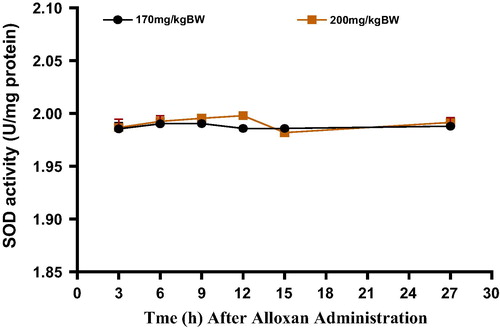
Fig. 4 Time course effect of Alloxan on Malondialdehyde (MDA) level in the pancreas of rat.
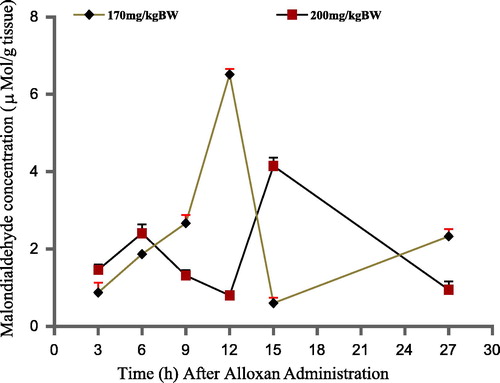
Fig. 5 Time course effect of Alloxan on Glutathione –S-transferase (GST) activity in the pancreas of rat.
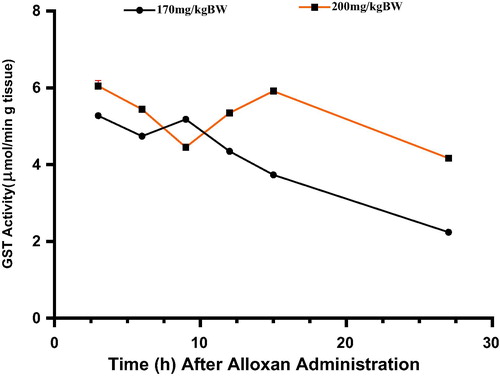
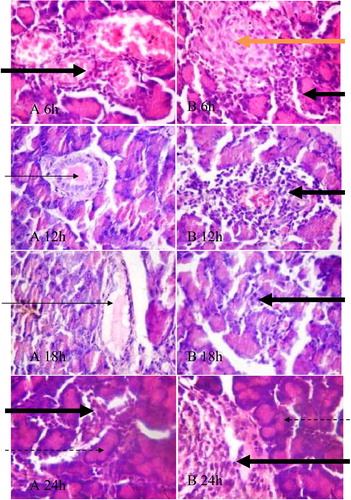
Fig. 6 Plates show focal area of a necrotic islet (orange arrow) and multifocal area of mild infiltration by inflammatory cells (black arrows), intralobular and interlobular ducts are essentially normal and in some cases contain pancreatic secretion (slender arrow) and normal exocrine acini (dotted arrows). A = 170 mg/kg BW alloxan treated rat, B = 200 mg/kg BW alloxan treated rat. 6 h, 12 h, 18 h and 24 h represent post alloxan treatment time.