Figures & data
Fig. 1 Serum levels of urea (A), creatinine (B), and LDH (C) in all groups. aP < 0.05 vs group I. bP < 0.05 vs group II.
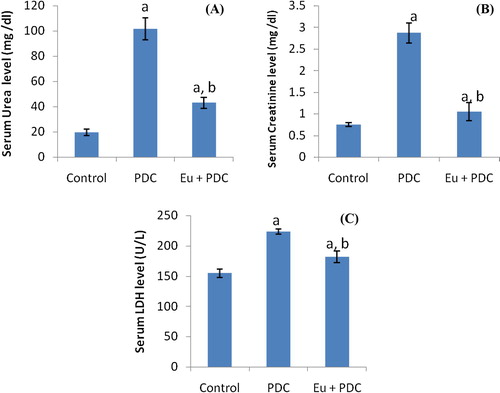
Fig. 2 Tissue levels of MDA (A), GSH (B), SOD (C), and TNF-α (D) in all groups. aP < 0.05 vs group I. bP < 0.05 vs group II.
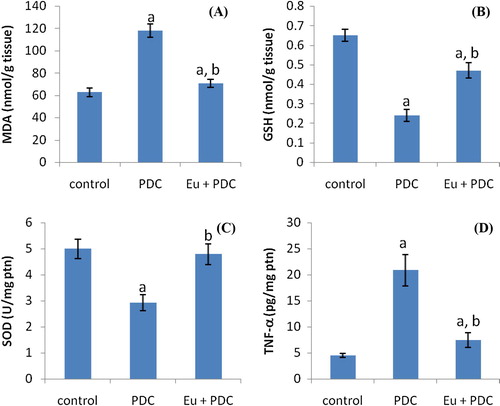
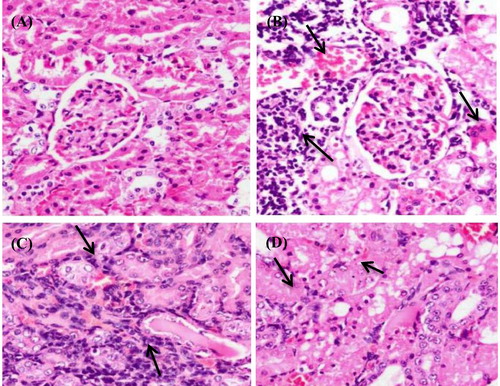
Fig. 3 Kidney histopathology (X400). (A) Control group: normal histological structure of the glomeruli and tubules. (B) PDC group: congestion of interstitial blood vessel, diffuse coagulative necrosis in most of the renal tubules and mononuclear cell infiltration. (C) PDC group: fibroblastic proliferation and mononuclear cell infiltration (D) Eu + PDC group: focal necrosis of epithelial lining associated with uniformly arranged regenerative renal tubules.