Figures & data
Table 1 Demographic, clinical and laboratory characteristics of patients in different groups.
Fig. 1 Urinary IP-10 (pg/ml) and CD25 (ng/ml) levels in different groups. (a) Urinary IP-10 (pg/ml) levels in different groups. (b) Urinary sCD25 (ng/ml) levels in different groups.
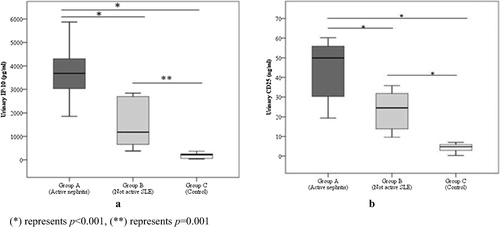
Fig. 2 Correlation between urinary IP-10 (pg/ml) with different parameters.
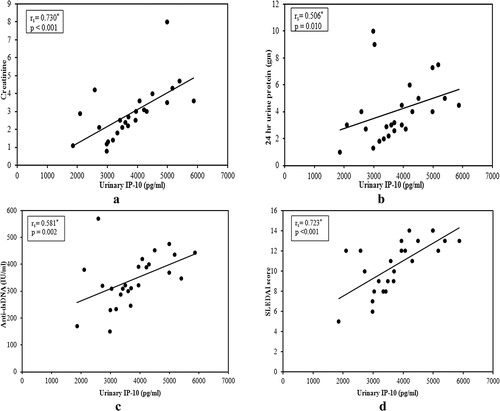
Fig. 3 Correlation between urinary CD25 (ng/ml) with different parameters.
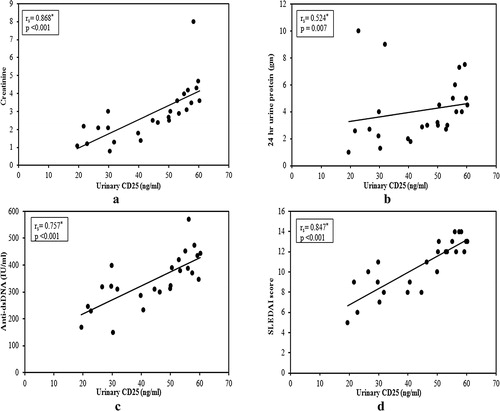
Table 2 Urinary levels of IP-10 (pg/ml) and CD25 (ng/ml) in different histological classes of renal biopsy.
Fig. 4 Relation between response to treatment with urinary IP-10 and urinary CD25 (Follow up).
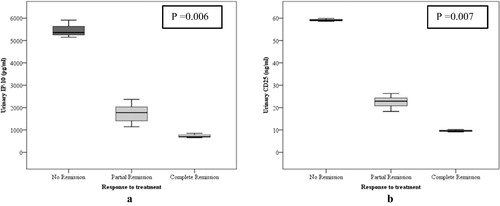
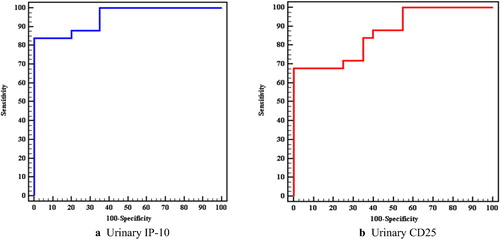
Fig. 5 ROC curve for urinary IP-10 and urinary CD25 to diagnose active LN vs SLE without activity (Group A vs B).