Figures & data
Table 1 The values of PSA and its derivatives.
Table 2 The %fPSA and histological diagnosis.
Figure 1 The ROC curve showing the sensitivity (true-positive rate) against (1 – specificity) (false-positive rate) for %fPSA levels. The AUC was 0.99, and P < 0.001.
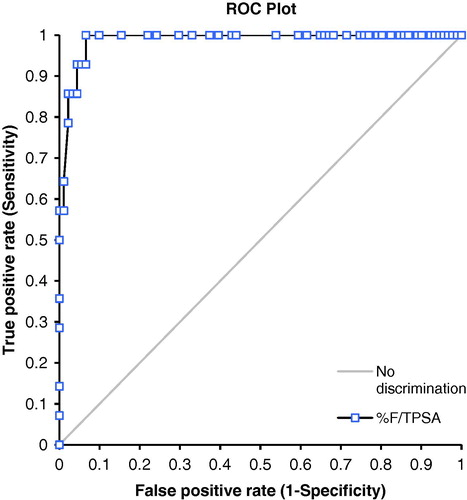
Figure 2 A decision plot showings the sensitivity (true-positive rate) and specificity (true-negative rate) curves of %fPSA levels. The point where the lines cross is the optimum threshold level. From the plot the decision level for %fPSA that optimally identified all the patients with cancer of the prostate (true positive) or nodular hyperplasia (true negatives) was <40%.
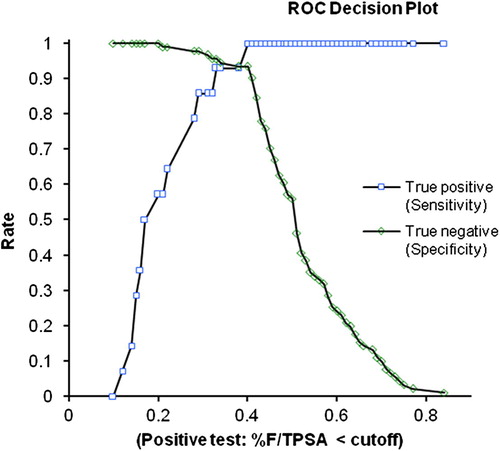
Table 3 The sensitivity, specificity and PPVs at various thresholds of %fPSA.
Table 4 Gleason scores and %fPSA values of the 14 patients with prostate cancer.
Table 5 The variation in the optimum %fPSA based on race.