Figures & data
Table 1 The effect of Ipre and Ipost on the variables of renal function, from 10 rats at each sample time.
Table 2 The effect of Ipre and Ipost on lipid peroxidation products (MDA), and the antioxidants SOD and GSH.
Figure 1 The effects of Ipre and Ipost on the tubulo-interstitial damage score at 2, 24 and 48 h after ischaemia in the different groups. Significant difference from the ∗sham group, #control group, and $significant from the Ipre group. One-way anova with Scheffe’s posthoc test (P < 0.05).
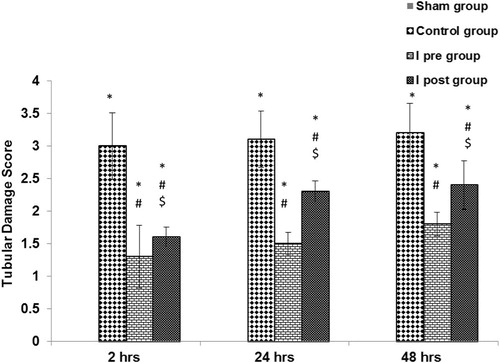
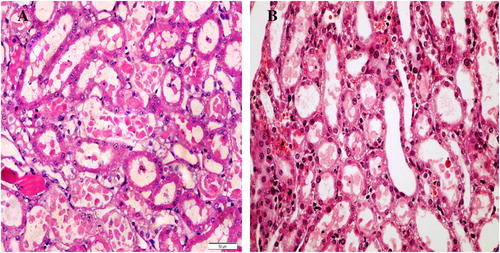
Figure 2 Sections of the kidney from the sham group (A), showing a normal appearance of glomeruli and tubules (score 0), and the control group (B), showing tubular necrosis at OSOM in >50% of tubules, score 4. H&E ×400).
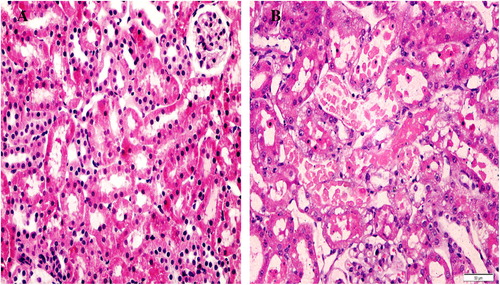
Figure 3 Sections from kidneys of the Ipre group at 24 h (A), showing tubular necrosis at OSOM in ≈35% of tubules, score 3 (H&E ×400); and the Ipre group at 48 h (B) showing tubular necrosis at OSOM in >10% of tubules, score 2 (H&E ×400).
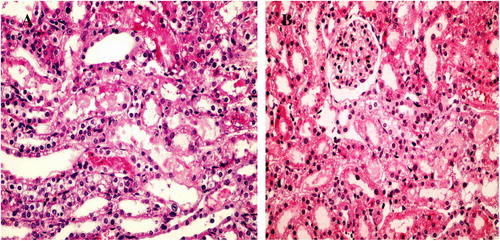
Figure 4 Sections from kidneys of the Ipost group at 24 h (A), showing tubular necrosis at OSOM in ≈70% of tubules, score 4 (H&E ×400), and in the Ipost group at 48 h (B) showing tubular necrosis at OSOM in ≈60% of tubules, score 4 (H&E ×400).