Figures & data
Fig. 1 All graphs satisfying the hypothesis of the conjecture for n 3.
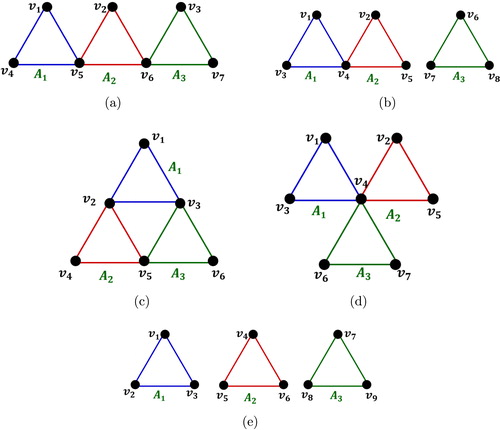
Fig. 2 4 copies of .
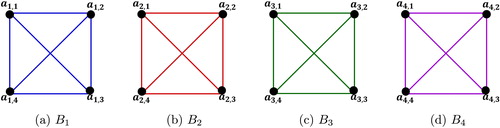
Fig. 3 Construction of from
.
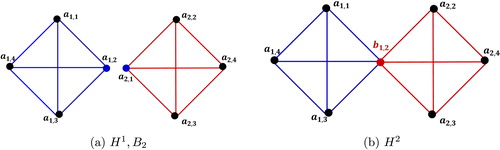
Fig. 4 Construction of from
.
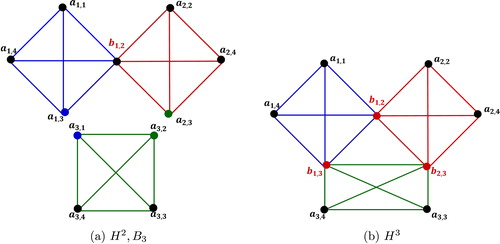
Fig. 5 Construction of from
.
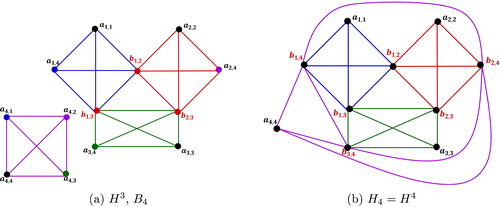
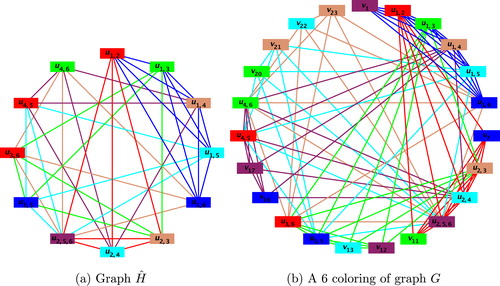
Fig. 6 .
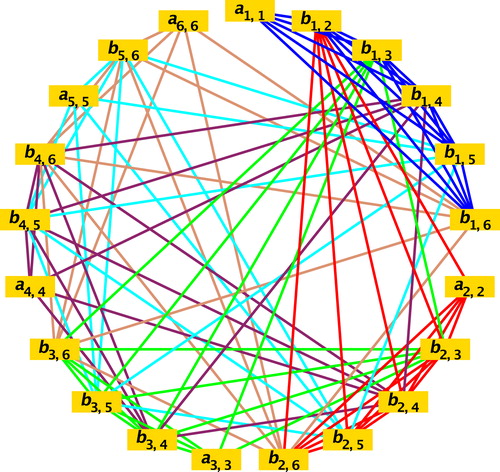
Fig. 7 Graph , before and after relabeling the vertices.
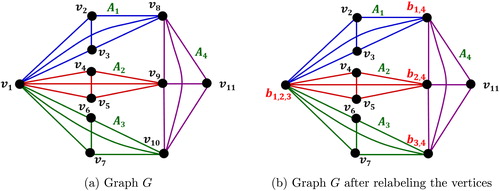
Fig. 8 Splitting the common vertices of which are not in
.
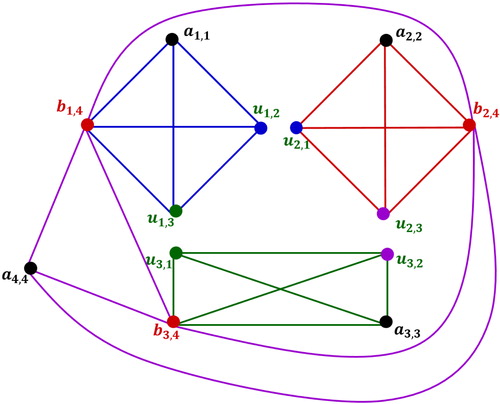
Fig. 9 Graph .
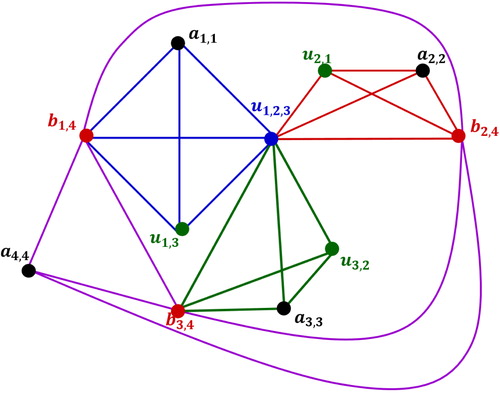
Fig. 10 A coloring of with six colors . (For interpretation of the references to color in this figure legend, the reader is referred to the web version of this article.)
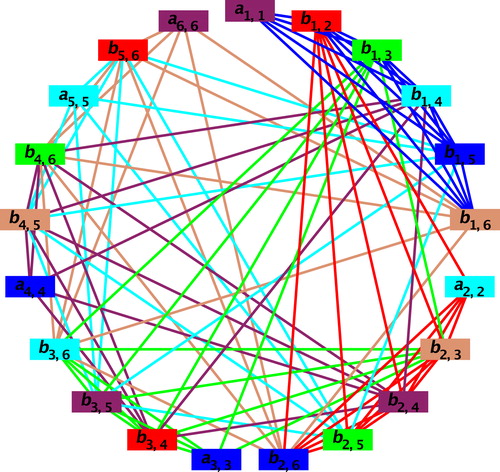
Fig. 11 Graph : before and after relabeling the vertices.
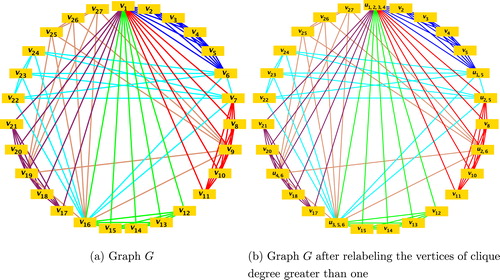
Fig. 12 Graph .
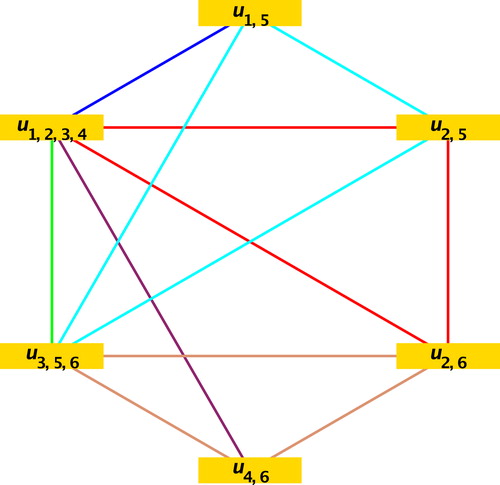
Fig. 13 The graphs and
, after colors have been assigned to their vertices . (For interpretation of the references to color in this figure legend, the reader is referred to the web version of this article.)
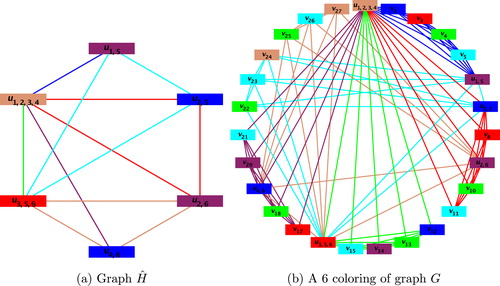
Fig. 14 Graph : before and after relabeling the vertices.
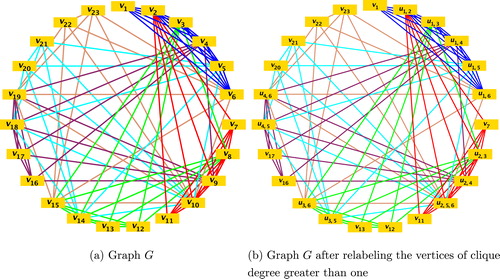
Fig. 15 Graph .
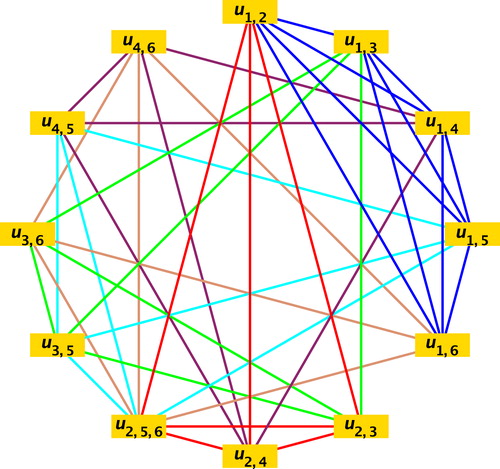
Fig. 16 The graphs and
, after colors have been assigned to their vertices . (For interpretation of the references to color in this figure legend, the reader is referred to the web version of this article.)