306
Views
0
CrossRef citations to date
0
Altmetric
Research Articles

Impact of a designed dietary protocol, with specially tailored total parenteral nutrition, on post-gastrectomy dumping syndrome and patient outcomeFootnote

, &
Pages 181-191 | Received 19 Apr 2011, Accepted 29 May 2011, Published online: 17 May 2019

Figures & data

Table 1 Frequency distribution of the two studied groups as regards socio-demographic characteristics (n = 30 in each group) expressed as number of patients in each group.

Table 2 Comparison between the two studied groups as regards anthropometric measurements throughout the assessment periods (n = 30 in each group).

Table 3 Comparison between the two studied groups as regards laboratory investigations (n = 30 in each group).

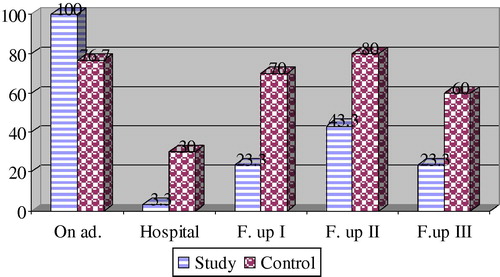
Table 4 Comparison between the studied groups as regards dumping syndrome symptoms (n = 30 in each group) expressed as number of patients in each group.

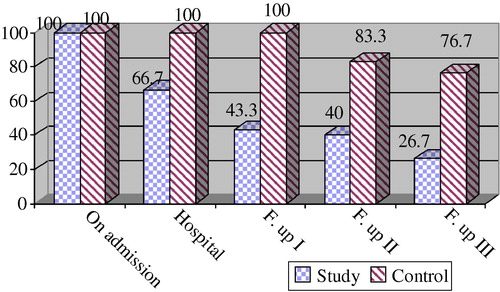
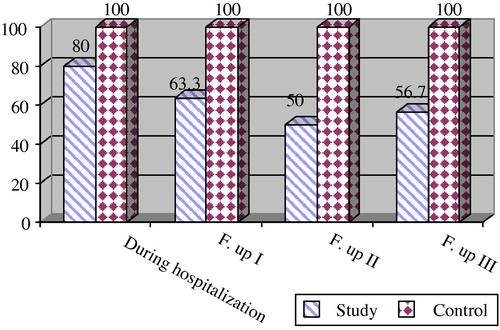
Table 5 Timing of dumping syndrome symptoms among the two studied groups (n = 30 in each group) expressed as number of patients in each group.

Table 6 Comparison between the study and control group subjects as regards wound assessment, on the fifth post-operative day and before discharge (n = 30 in each group).

Figure 1 Comparison between the percent of subjects with significant (rapid) weight loss in both studied Groups (n  = 30 in each group). On Ad. = On hospital admission F.up I–III  = Follow up I–III, respectively. P < 0.01 between both groups on hospital, Follow up I—III assessments.
Figure 2 Percentage of Nutritional Status Alteration (Malnutrition) among the Two Studied Groups (n = 30 in each group). F.up I–III = Follow up I–III, respectively. P < 0.01 between both groups on hospital, Follow up I–III assessments.
Figure 3 Percentage distribution of dumping syndrome among the studied groups all through the assessment periods (n = 30 in each group). F.up I–III  = Follow up I–III, respectively. P < 0.01 between both groups on hospital, Follow up I–III assessments.

Table 7 Studied groups’ anthropometric measurements in relation to age all through the assessment periods (n = 30 in each group).

Table 8 Correlation between the studied groups’ laboratory investigations and age (n = 30 in each group).

Table 9 Studied groups’ serum albumin level in relation to gender (n = 60).

Table 10 Correlations between the studied groups’ laboratory investigations and hospital stay (n = 30 in each group).

Table 11 Dumping syndrome symptoms in relation to the type of surgery expressed as number of patients in each group (n = 30 in each group).