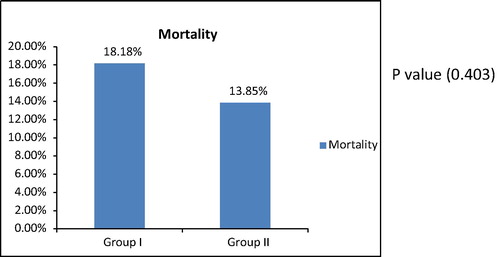
igure 1 Incidence of mortality in group I and group II. Causes of mortality in group I (intensive treatment group) included sepsis, myocardial infarction, hypovolemic shock and Central nervous system (CNS) catastrophe with an incidence of 70%, 10%, 10% and 10% respectively of mortality cases, while in group II (conventional treatment group) causes of mortality included sepsis, respiratory failure and CNS catastrophe with an incidence of 55%, 33% and 11% respectively of mortality cases.
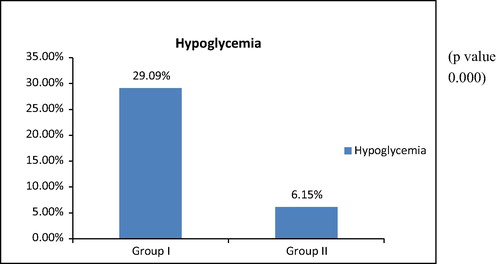
igure 2 Percentage of hypoglycemia in group I and group II. Incidence of hypoglycemia was 29% in group I (intensive treatment group), and 6% in group II (conventional treatment group) with P value <0.05 which is statistically significant.
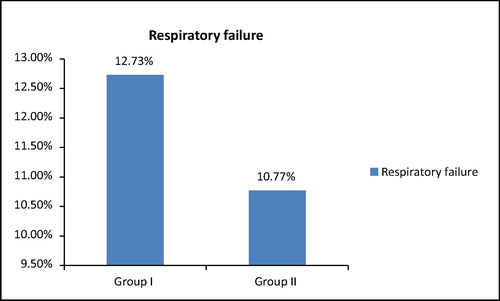
igure 3 Percentage of respiratory failure in group I (intensive treatment group) and Group II (conventional treatment group). Incidence of respiratory failure in group I was 12.7% versus 10.7% in group II with P value (0.667) which is statistically insignificant.
able 2 Systolic blood pressure in group I (55 patients) and group II (65 patients). Data are represented in terms of mean ± standard deviation.
able 1 Demographic data of IIT group (55 patients, group I) and conventional group (65 patients, group II). Data are represented as mean ± standard deviation (SD) and percentage.
able 9 ICU and total hospital stay in group I (55 patients) and group II (65 patients) in days. Data are presented in terms of mean ± standard deviation.