Artemether-Lumefantrine treatment combined with albendazole and ivermectin induced genotoxicity and hepatotoxicity through oxidative stress in Wistar ratsFootnote
Peer review under responsibility of Mansoura University.
E.T. IdowuParasitology Unit, Department of Zoology, University of Lagos, Akoka, Lagos, Nigeria
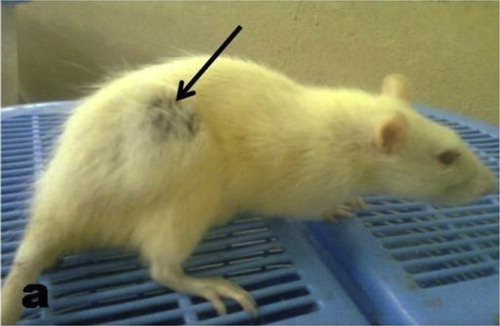
Fig. 1 Abscess on the thigh region of the right leg of rat exposed to Artemether/Lumefantrine (20/120 mg/bwt) and Ivermetin (3 mg/kg), sign of clinical toxicity to drug exposure.
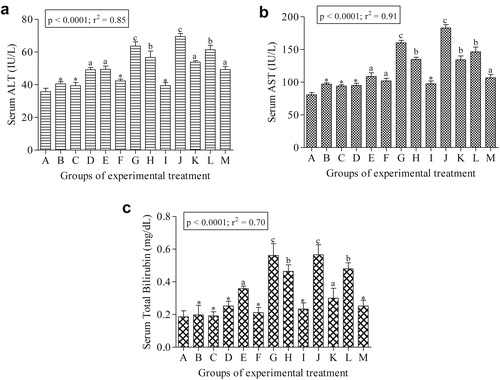
Fig. 2 a. Effects of drug exposure on serum ALT activity of rat. End point represents mean ± SE for 5 rats. Values are significantly different; ap < 0.05; bp < 0.01; cp < 0.001 and *p > 0.05 compared to negative control. b. Effects of drug exposure on serum AST activity of rat. End point represents mean ± SE for 5 rats. Values are significantly different; ap < 0.05; bp < 0.01; cp < 0.001 and *p > 0.05 compared to negative control. c. Effects of drug exposure on total bilirubin concentration of rat. End point represents mean ± SE for 5 rats. Values are significantly different; ap < 0.05; bp < 0.01; cp < 0.001 and *p > 0.05 compared to negative control.
Table 2 Effects of drug combinations on serum CAT, SOD and MDA in treated and control rats.
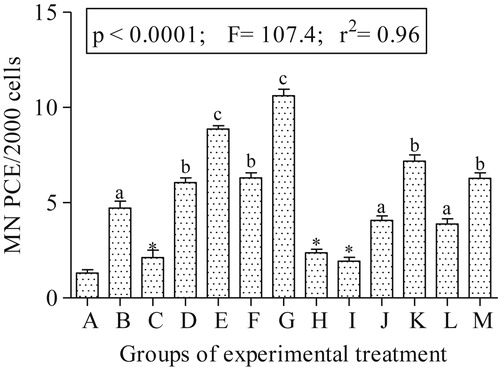
Fig. 3 Frequency of micronucleated polychromatic erythrocytes in bone marrow cells of rats exposed to drugs and controls. End point represents mean ± SE for 5 rats. Values are significantly different; ap < 0.05; bp < 0.01; cp < 0.001 and *p > 0.05 compared to negative control.
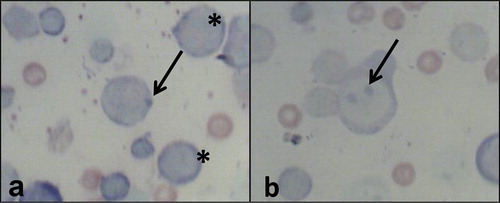
Fig. 4 (a–b): Asterisks showed normal polychromatic erythrocytes while arrows showed micronucleated polychromatic erythrocytes from bone marrow cells of rats.
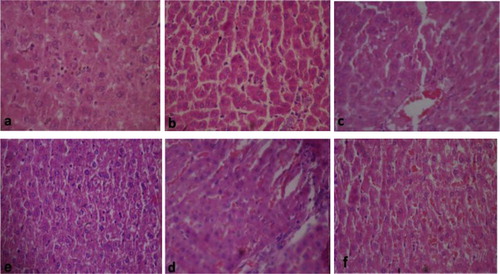
Fig. 5 Liver tissues of rats exposed to drug combinations (H&E, x 400). (a) Section of liver from rat in the negative control group showing relatively normal hexagonal or pentagonal lobule of hepatocytes. (b) Single cell hepatocellular necrosis and kupffer cell hyperplasia (c) Multiple foci vacuolar changes and congestion of the sinusoids. (d) Thinning of hepatic cord and single cell hepatocellar necrosis. (e) Vacuolar changes in the hepatocytes and mild congestion of the sinusoids. (f) Severe congestion of the sinusoids by inflammatory cells.