755
Views
23
CrossRef citations to date
0
Altmetric
Full Length Article

Cardioameliorative effect of punicalagin against streptozotocin-induced apoptosis, redox imbalance, metabolic changes and inflammation

, , , , &
Pages 247-260 | Received 27 Jul 2015, Accepted 08 Sep 2015, Published online: 13 Mar 2019

Figures & data

Fig. 1 Effects of streptozotocin (STZ) and punicalagin (PU) on blood glucose and body weights in rats in different groups during the experimental period. The values are expressed as the means ± SEM. (n = 7).

Table 1 Effects of streptozotocin (STZ) and punicalagin (PU) on the serum glucose (mg/dl) and insulin (pg/ml) levels and the percentages of HbA1c and HOMA-IR in rats in different groups at the end of the experimental period.

Fig. 2 Effect of streptozotocin (STZ) and punicalagin (PU) on the lipid profile [total lipids (a), cholesterol (b), triglycerides (c), low-density lipoprotein (d), high-density lipoprotein (e), and very-low-density lipoprotein (f)] expressed as mg/dl in the serum in rats in different groups. The values are expressed as the means ± SEM. (n = 7). *, # Significant at P < 0.05, **, ## significant at P < 0.01, and ***, ### significant at P < 0.001. *, **, *** indicate comparisons with respect to the control group. #, ##, ### indicate comparisons with respect to the diabetic group.

Table 2 Effects of streptozotocin (STZ) and punicalagin (PU) on the serum troponin T concentration (pg/ml) and CK-MB and LDH activities (U/ml) rats in different groups.

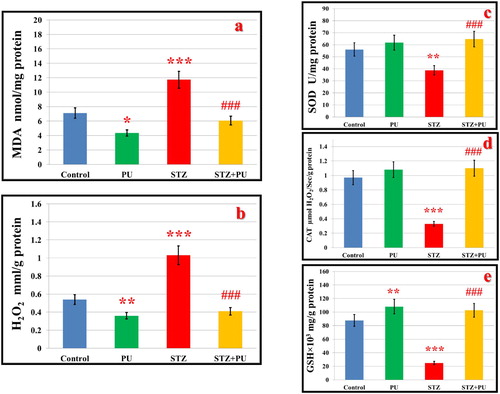
Fig. 3 Effect of streptozotocin (STZ) and punicalagin (PU) on the levels of the lipid peroxidation product MDA (nmol/mg protein) (a), hydrogen peroxide (H2O2)(mmol/g protein) (b), superoxide dismutase (SOD; U/mg protein) (c), and catalase (CAT; µmol H2O2/Sec/g protein) (d), glutathione (GSH; mg/g protein) (e) in the hearts of rats in different groups. The values are expressed as the means ± SEM. (n = 7). *, # Significant at P < 0.05, **, ## significant at P < 0.01, and ***, ### significant at P < 0.001. *, **, *** indicate comparisons with respect to the control group. #, ##, ### indicate comparisons with respect to the diabetic group.

Table 3 Effect of streptozotocin (STZ) and punicalagin (PU) on the serum IL-6, IL-1b, and TNF-α levels, expressed as pg/ml, in rats in different groups.
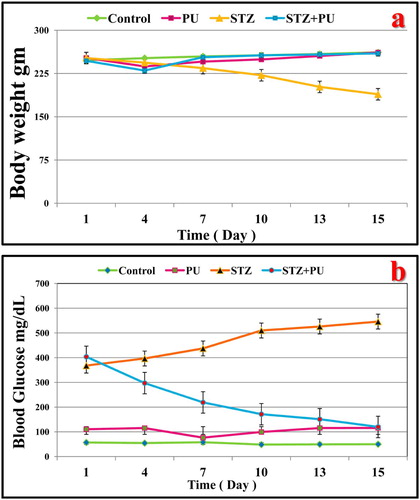
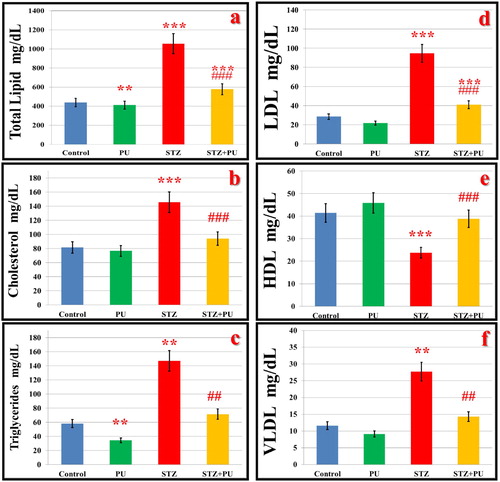
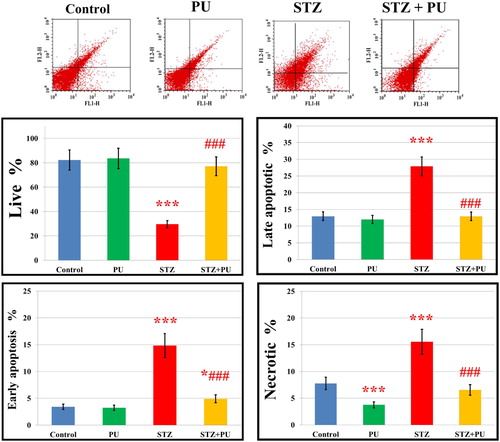
Fig. 4 Effects of streptozotocin (STZ) and punicalagin (PU) on the percentage of apoptosis in rats in different groups. Flow cytometry results showing examples of the data generated by FACS are at the top of each histogram. The values are expressed as the means ± SEM. (n = 7). *, # Significant at P < 0.05, **, ## significant at P < 0.01, and ***, ### significant at P < 0.001. *, **, *** indicate comparisons with respect to the control group. #, ##, ### indicate comparisons with respect to the diabetic group.
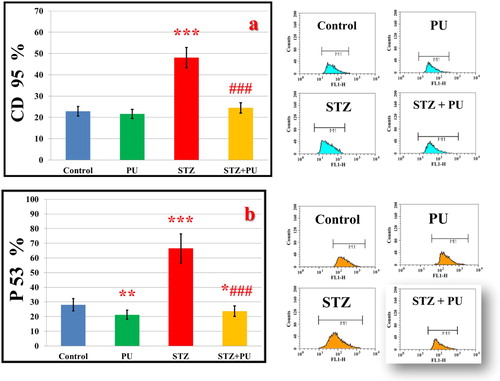
Fig. 5 Effects of streptozotocin (STZ) and punicalagin (PU) on the percentage of CD95 (a) and P53 (b) in rats in different groups. Flow cytometry results showing examples of the data generated by FACS are at the side of each histogram. The values are expressed as the means ± SEM. (n = 7). *, # Significant at P < 0.05, **, ## significant at P < 0.01, and ***, ### significant at P < 0.001. *, **, *** indicate comparisons with respect to the control group. #, ##, ### indicate comparisons with respect to the diabetic group.
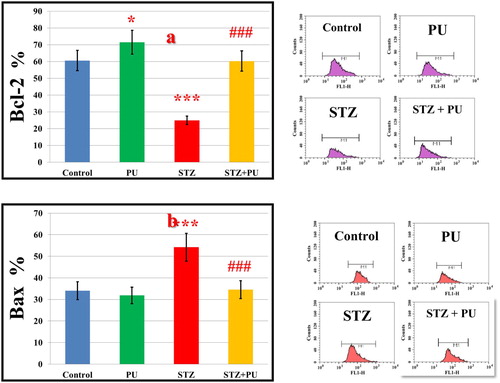
Fig. 6 Effects of streptozotocin (STZ) and punicalagin (PU) on the percentage of Bcl-2 (a) and Bax (b) in rats in different groups. Flow cytometry results showing examples of the data generated by FACS are at the side of each histogram. The values are expressed as the means ± SEM. (n = 7). *, # Significant at P < 0.05, **, ## significant at P < 0.01, and ***, ### significant at P < 0.001. *, **, *** indicate comparisons with respect to the control group. #, ##, ### indicate comparisons with respect to the diabetic group.
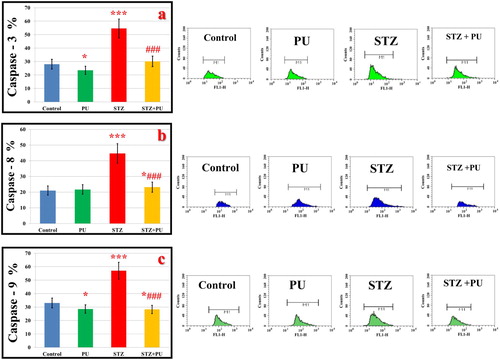
Fig. 7 Effects of streptozotocin (STZ) and punicalagin (PU) on caspases 3 (a), 8 (b) and 9 (c) expressions in rat hearts in rats in different groups. Flow cytometry data showing examples of the data generated by FACS are at the side of each histogram. The values are expressed as the means ± SEM. (n = 7). *, # Significant at P < 0.05, **, ## significant at P < 0.01, and ***, ### significant at P < 0.001. *, **, *** indicate comparisons with respect to the control group. #, ##, ### indicate comparisons with respect to the diabetic group.
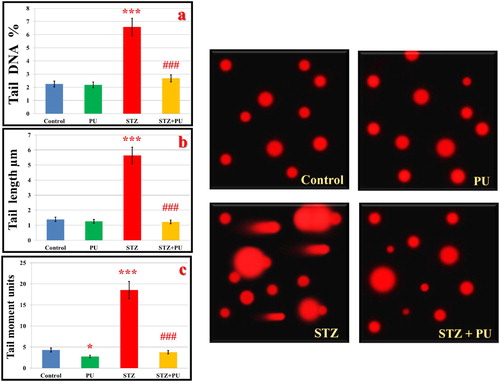
Fig. 8 Effect of streptozotocin (STZ) and punicalagin (PU) on the percentage of DNA damage in hearts of rats in different groups using the alkali comet assay that detects DNA single-strand breaks. (a) Percent of tail DNA, (b) tail length, and (c) tail moment. The appearance of the microscopic images of representative comets for the different groups is shown. The values are expressed as the means ± SEM. (n = 7). *, # Significant at P < 0.05, **, ## significant at P < 0.01, and ***, ### significant at P < 0.001. *, **, *** indicate comparisons with respect to the control group. #, ##, ### indicate comparisons with respect to the diabetic group.
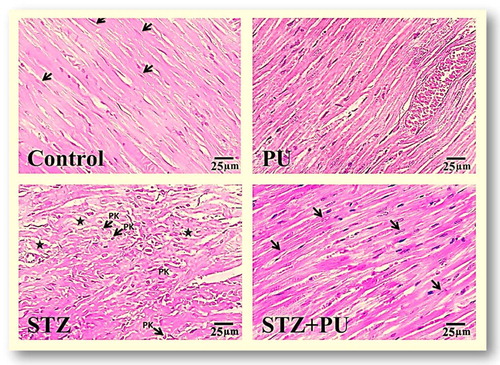
Fig. 9 Hematoxylin and eosin-stained heart sections of (a) control rat illustrating the regular arrangement of myocardial fibers with oval nuclei (arrows); (b) punicalagin-treated (PU) rat showing no remarkable changes; (c) streptozotocin-induced diabetic rats (STZ) illustrating the disorganized arrangement of the myocardial structure, myocyte degeneration (*) and pyknotic nuclei (Pk); and (d) streptozotocin + punicalagin-treated (STZ + PU) animals displaying an improvement in most of the cardiac muscle fibers with centrally located nuclei (arrows) (Scale bar is 25 µm).