365
Views
10
CrossRef citations to date
0
Altmetric
Full Length Article

Synthesis and characterization of Hg(II) and Cd(II) complexes derived from the novel acenaphthaquinone-4-phenyl thiosemicarbazone and its CPE application

, , , &
Pages 106-117 | Received 30 Aug 2015, Accepted 27 Oct 2015, Published online: 08 Mar 2019

Figures & data

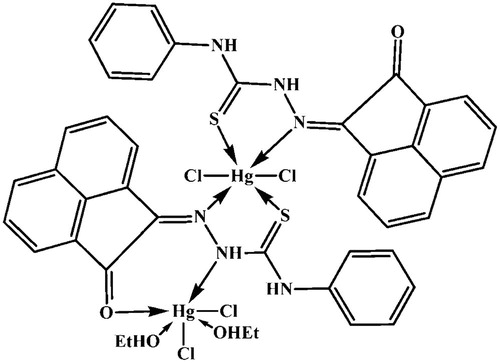
Table 1 Analytical and physical data of APTH and its complexes.

Fig. 1 IR spectrum of APTH in comparison to acenaphthoquinone.
Fig. 2 IR deconvolution analysis of APTH in the range 1710–1620 cm−1.

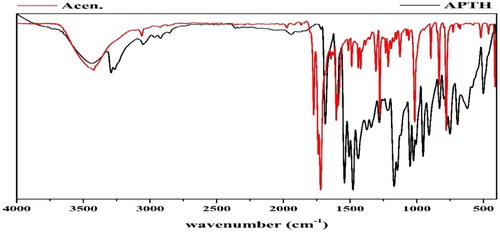
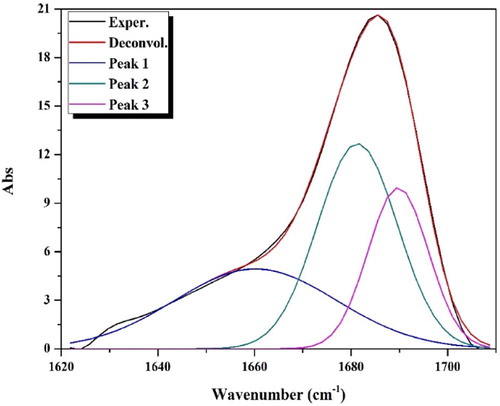
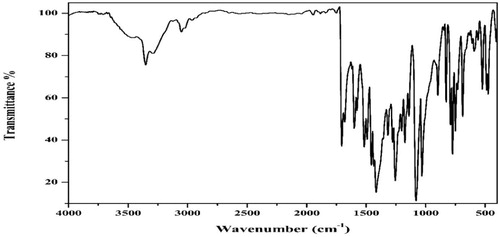
Table 2 Infrared spectral date of APTH and its metal complexes in KBr.

Table 3 Deconvolution analysis parameters of the APTH IR spectrum in the range 1710–1620 cm−1 (R2 = 0.9986).

Fig. 3 1H-NMR spectrum of APTH.
Structure 1 Structure of APTH.
Scheme 1 Fragmentation pattern of APTH.
Fig. 4 Electronic spectrum of APTH.
Fig. 5 IR deconvolution analysis of [Cd2(APTH)Cl4] in the range 1700–1620 cm−1.
Structure 2 Structure of Cd(II) complex.

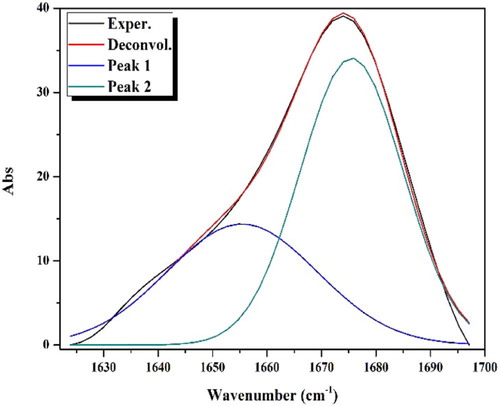
Table 4 Deconvolution analysis parameters of the [Cd2(APTH)Cl4] IR spectrum in the range 1700–1620 cm−1 (R2 = 0.9966).

Fig. 6 IR spectrum of [Hg2(APTH)2Cl4(EtOH)2].
Structure 3 Structure of Hg(II) complex.
Fig. 7 1H-NMR spectrum [Cd2(APTH)Cl4] complex.
Fig. 8 Effect of pH on the extraction recovery of Cd(II) and Hg(II) using APTH (10−5 M) and Triton X-114 (0.1 % w/v).
Fig. 9 Effect of APTH concentration on the extraction recovery of Cd(II) and Hg(II) using Triton X-114 (0.1 % w/v) at pH 7.
Fig. 10 Effect of Triton X-114 concentration on the extraction recovery % of the Cd(II) and Hg(II) using APTH (2 × 10⁻⁵ M) at pH 7.
Fig. 11 Effect of temperature on the extraction recovery % of the Cd(II) and Hg(II) using APTH (2 × 10⁻⁵ M) and Triton X-114 (0.1 %w/v) at pH 7.
Fig. 12 Effect of incubation time on the extraction recovery % of the Cd(II) and Hg(II) using APTH (2 × 10⁻⁵ M) and Triton X-114 (0.1 %w/v) at pH 7.
Fig. 13 Calibration curve of the Cd(II) using APTH (2 × 10⁻⁵ M) and Triton X-114 (0.1 %w/v) at pH 7.
Fig. 14 Calibration curve of the Hg(II) using APTH (2 × 10⁻⁵ M) and Triton X-114 (0.1 % w/v) at pH 7.

Table 5 Tolerance limits for interference ions.

Table 6 Determination of the Hg(II) and Cd(II) in 50 ml water samples using the presented CPE procedure in comparison with those obtained by FAAS.

Table 7 CPE applications for metal ions analysis of the current work in comparison with previous studies.