502
Views
7
CrossRef citations to date
0
Altmetric
Full Length Article

Vegetation structure and soil characteristics of five common geophytes in desert of Egypt

Pages 172-186 | Received 20 Oct 2015, Accepted 01 Mar 2016, Published online: 08 Mar 2019

Figures & data

Fig. 1 Map of Egypt showing the location of study area.

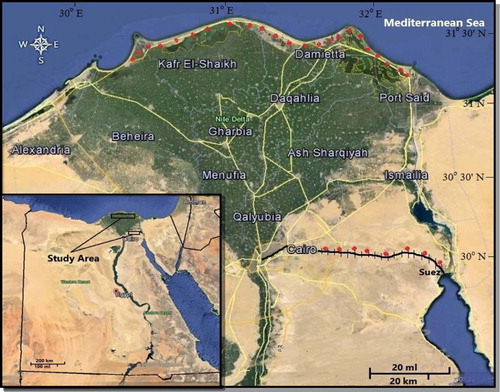
Table 1 Long-term averages (≥20 years) of the climatic records at four stations in northern sector of the Nile Delta and Galalah Desert [Citation26].

Fig. 2 Plant life form spectra in the different habitats of the study area. For life form abbreviations, see Appendix.
Fig. 3 Chorotype spectrum diagram of the coastal and inland desert. For chorotype abbreviations, see Appendex.
Fig. 4 Dendrogram showing cluster analysis of the studied 95 stands, with the 6 vegetation groups (A-D2) separated.

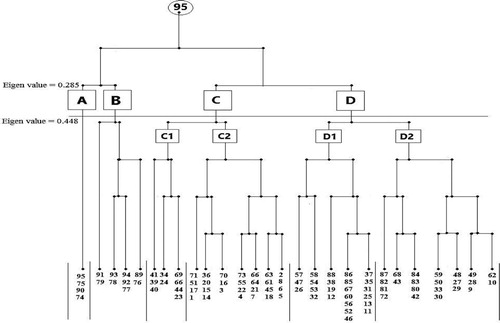
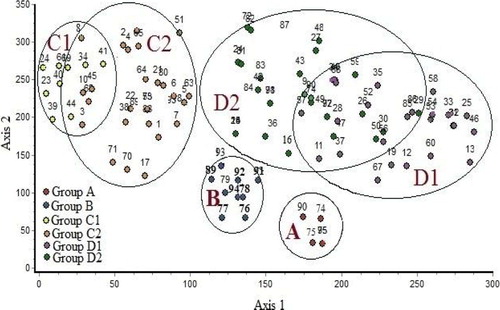
Table 2 Species composition of the obtained 6 vegetation groups in 95 sites in the two phytogeographical regions. Species in bold are the geophyte plants.

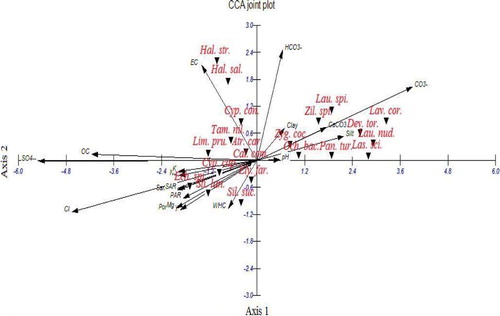
Table 3 Mean values, standard error (±SE) and ANOVA values of the soil variables in the vegetation groups (A-D2) of the study area. EC = Electrical conductivity, OC = Organic carbon, ns = not significant at P < 0.05. *: Values are significant at P < 0.05, **: Values are significant at P < 0.01, ***: Values are significant at P < 0.001.

Fig. 5 DCA ordination diagram of the 95 sites on axes 1 and 2 within vegetation groups (A-D2).
Fig. 6 CCA ordination diagram of the first two axes showing the distribution of the plant species with soil variables in the study area.

Table 4 Simple linear correlation coefficients between studied geophytes and soil variable. EC = Electrical conductivity, OC = Organic carbon. *: Values are significant at P < 0.05, **: Values are significant at P < 0.01.