Figures & data
Fig. 1 Levels of the neurotransmitters, norepinephrine (a), dopamine (b), and serotonin (c) in cerebral cortex, cerebellum, and brain stem after the treatment with As and TQ. a: Significance at (P < 0.05) as compared to control group, b significance at (P < 0.05) as compared to arsenic group.
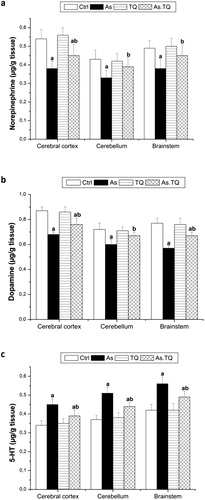
Fig. 2 Acetyl choline esterase activity (a) and Na+-K+ ATPase activity (b) in cerebral cortex, cerebellum, and brain stem after the treatment with As and TQ. a: Significance at (P < 0.05) as compared to control group, b significance at (P < 0.05) as compared to arsenic group.
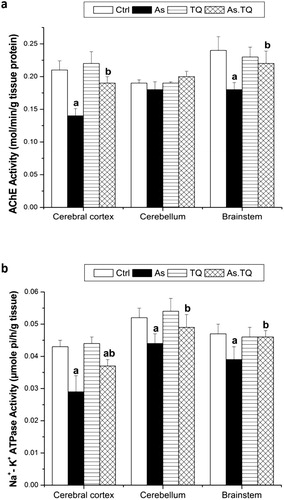
Fig. 3 Lipid peroxidation level (a), nitrite/nitrate level (b), and Glutathione levels (C) in cerebral cortex, cerebellum, and brain stem after the treatment with As and TQ. a: Significance at (P < 0.05) as compared to control group, b significance at (P < 0.05) as compared to arsenic group.
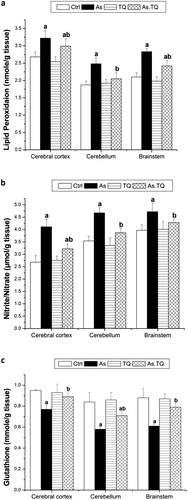
Fig. 4 Glutathione reductase (a), glutathione peroxidase (b), superoxide dismutase (c), and catalase (d) levels in cerebral cortex, cerebellum, and brain stem after the treatment with As and TQ. a: Significance at (P < 0.05) as compared to control group, b significance at (P < 0.05) as compared to arsenic group.
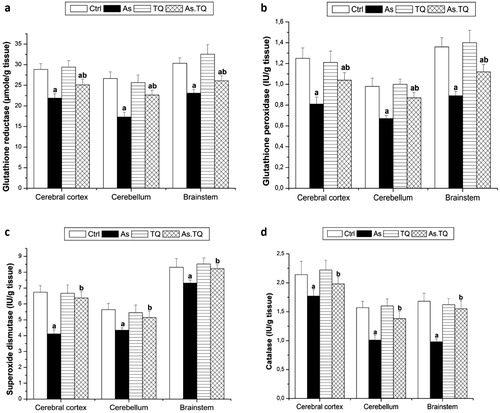
Fig. 5 Levels of TNF-α in cerebral cortex, cerebellum, and brain stem after the treatment with As and TQ. a: Significance at (P < 0.05) as compared to control group, b significance at (P < 0.05) as compared to arsenic group.
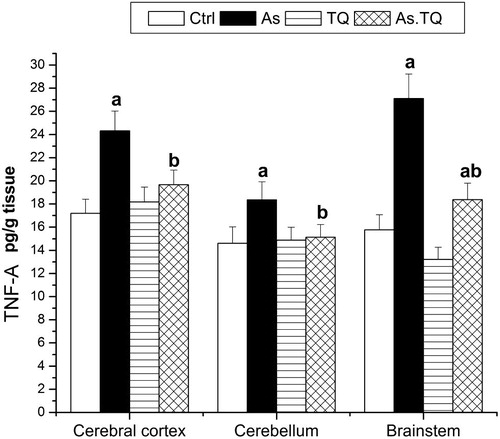
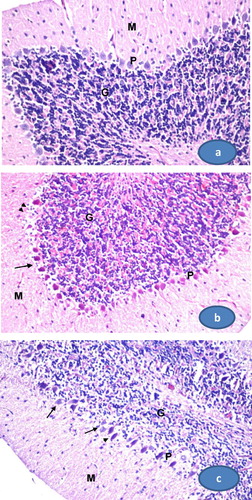
Fig. 6 Photomicrographs of rat cerebellum. (a) A section from control group showing the normal histological structure of cerebellum which consists of the outer molecular layer (M), middle Purkinje cell layer (P), and inner granular layer (G). (b) A section from arsenate treated group. The Purkinje cells are degenerated; some cells lose axons and shrinked (arrows). Their numbers are decreased and some areas are depleted from Purkinje cells (arrow heads). (c) A section from cerebellum treated with TQ after arsenate showing normal Purkinje cells (arrows) and other shrinked cells (arrow heads). (400×, H&E stain).