Figures & data
Fig. 1 Schematic illustration of the prepared polyphenon-E-loaded chitosan nanoparticles.
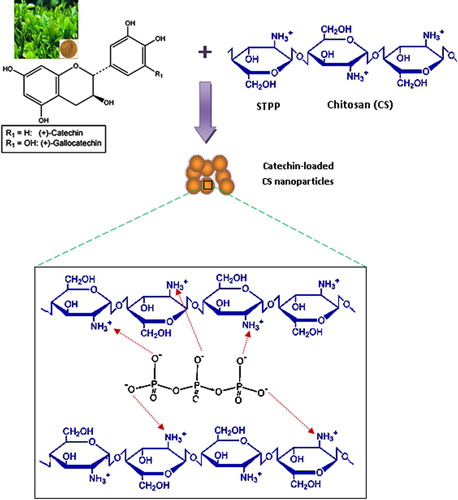
Fig. 2 (A&B) Transmission electron micrographs of the prepared void (A2) nanoparticles, and catechin-loaded CS (A2-D) nanoparticles. (C) Swelling behavior of the CS nanoparticles of different STPP concentrations (A1 and A2) in PBS (pH 7.4) at 37 °C. (D) Cumulative release study of the loaded Catechin from the CS nanoparticles of different crosslinking extents (A1-D and A2-D) at 37 °C in PBS (pH 7.4). The values are average of three triplicates.
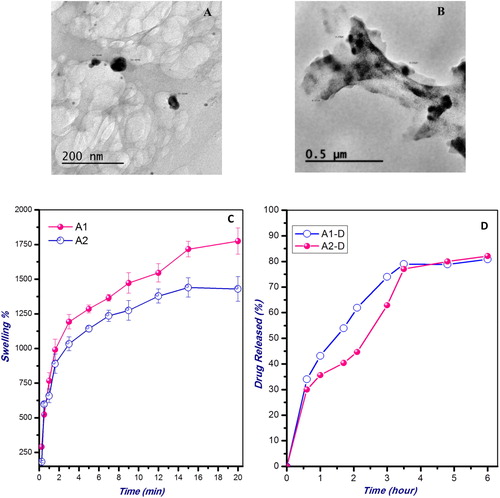
Table 1 The average particle size of the prepared void and PE-loaded CS nanoparticles of different compositions and their entrapment efficiencies.
Fig. 3 Effect of polyphenon-E (PE) encapsulated into chitosan nanoparticles (CSNPs-PE) on (A) body weight changes and (B) tumor volume. EAC cells (2x10⁶ cells/mouse) were injected subcutaneously to induce solid tumor in Swiss albino mice. CSNPs-PE was orally administered daily for 30 days. Values are mean ± SEM of three determinations. *P < .05 vs control group and ■P < .05 vs PE-treated group.
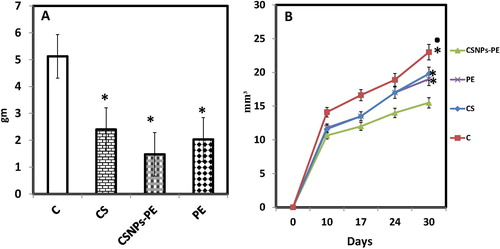
Fig. 4 Effect of polyphenon-E (PE) encapsulated into chitosan nanoparticles (CSNPs-PE) on cell cycle phases. The cell cycle distribution of EAC nuclear DNA was determined by flow cytometer using propidium iodide staining in EAC bearing-mice in different animal groups. The DNA histogram shows the distribution and the percentage of cells in phases of the cell cycle. Histogram display of DNA content (x-axis, PI-fluorescence) versus counts (y-axis) has been shown. Values are expressed as percentage of the cell population in the G0/G1, S and G2/M phases of cell cycle. The CSNPs-PE caused cell cycle arrest at G0/G1 phase with decreased cell population in S phase.
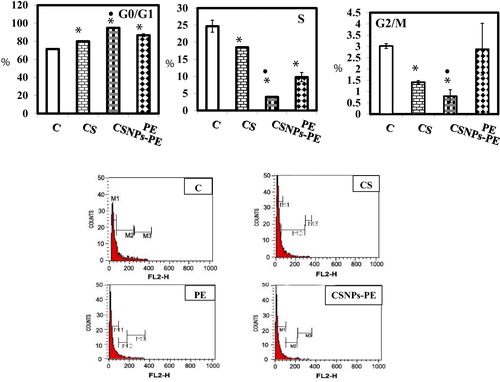
Fig. 5 Effect of polyphenon-E (PE) encapsulated into chitosan nanoparticles (CSNPs-PE) on expression of PCNA (A) and p53 (B) in tumor tissues of mice. Tumor sections were stained using specific antibodies. Counterstaining was performed with hematoxylin. Photomicrographs (magnification, ×20) show representative pictures from two independent samples (A). P53 was estimated using flow cytometer (B). *P < .05 vs control group and ■P < .05 vs PE-treated group. CSNPs-PE downregulated PCNA and upregulated p53 in tumor tissue.
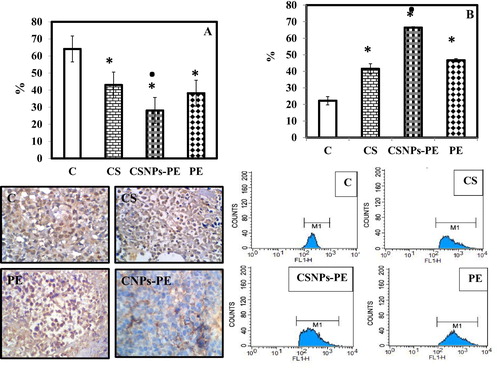
Fig. 6 Effect of polyphenon-E (PE) encapsulated into chitosan nanoparticles (CSNPs-PE) on expression of angiogenic indicators VEFG and CD31 in tumor tissues of mice. Tumor sections were stained using specific antibodies for each parameter. Counterstaining was performed with hematoxylin. Photomicrographs (magnification, ×20) show representative pictures from two independent samples. *P < .05 vs control group and ■P < .05 vs PE-treated group. CSNPs-PE downregulated expressions of VEGF and CD31 in tumor sections indicating inhibition of angiogenesis.
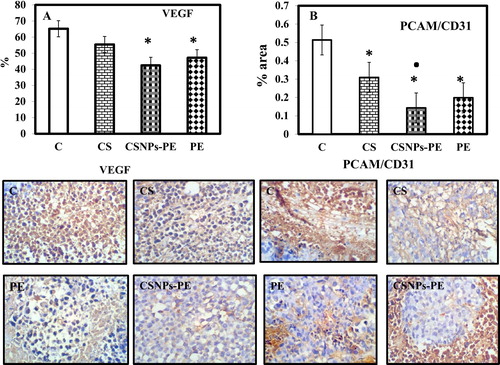
Fig. 7 Flow cytometry data showing examples of the data generated by FACS. Dual parameter dot plot of FITC-fluorescence (x-axis) versus PI-fluorescence (y-axis) has been shown in logarithmic fluorescence intensity. The events shown in the lower left quadrant represent viable cells, and the upper left quadrant is indicative of necrotic cells that have taken up the PI. The percentage of early apoptotic cells that are Annexin V positive only is represented in the lower right quadrant, and events depicting late apoptotic cells that are Annexin V/ PI positive are shown in the upper right quadrant. CSNPs-PE produced remarkable late apoptosis and necrosis. Values are mean ± SEM of three determinations. *P < .05 vs control group and ■P < .05 vs PE-treated group.
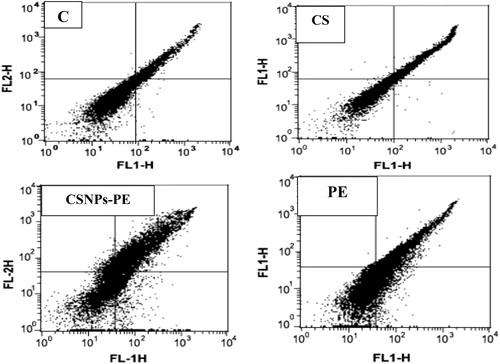
Table 2 Effect of polyphenon-E (PE) encapsulated into chitosan nanoparticles (CSNPs-PE) on EAC apoptosis and necrosis using flow cytomety. In a double label system, unfixed EACs from different animal groups of tumor-bearing mice were labeled with PI and Annexin V Fluos and then fixed and analyzed on a Flow cytometer.
Fig. 8 (A) Percent expression of Bcl-2, Bax, CD95, and caspases 3, 8, and 9 of EAC cells from EAC-bearing animals of all groups measured by flow cytometry using specific antibody. Values are mean ± SEM of three determinations. *P < .05 vs control group and ■P < .05 vs PE-treated group. The CSNP-PE oral treatment for 30 days showed increased expressions of Bax, CD95, and caspases-3, 8, and 9 and downregulated Bcl-2 expression in tumor. (B) Flow cytometry data showing examples of the data generated by FACS.
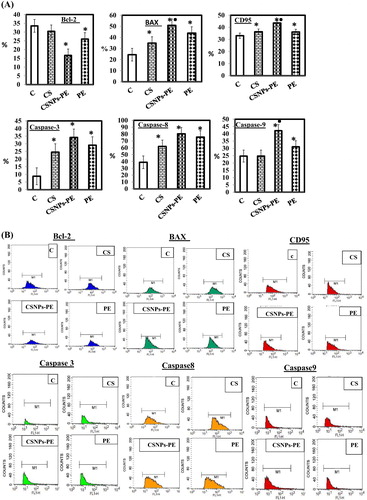
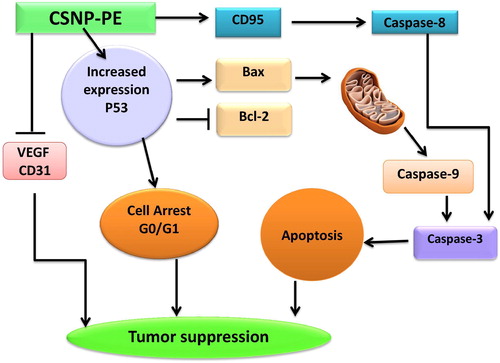
Fig. 9 Molecular mechanism of cancer cell death induced by CSNPs-PE in tumor tissue. CSNPs-PE upregulated proapoptotic proteins BAX, and p53, activate caspases-3, 8 and 9, and CD95, with concomitant decrease in the expression of Bcl-2 and inhibition of VEGF and CD31 expressions in tumor tissue. These changes lead to apoptosis and inhibition of tumor growth.