Figures & data
Table 1 Clinical characteristics of metastatic and non-metastatic breast cancer patients.
Fig. 1 The median and range of thioredoxin-1 level (Trx-1) (ng/ml) in metastatic breast cancer (MBC), non-metastatic breast cancer (NMBC) and control groups.
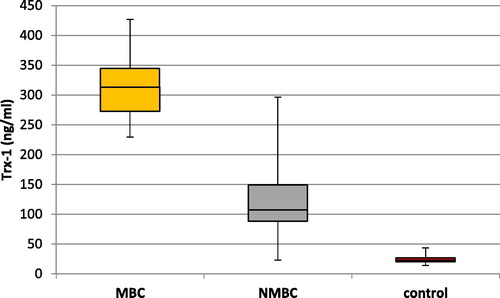
Fig. 2 The median and range of matrix metalloproteinase-9 level (MMP-9) (ng/ml) in metastatic breast cancer (MBC), non-metastatic breast cancer (NMBC) and control groups.
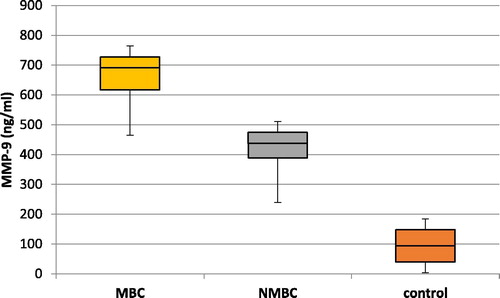
Fig. 3 The median and range of malondialdehyde level (MDA) (nmol/ml) in metastatic breast cancer (MBC), non-metastatic breast cancer (NMBC) and control groups.
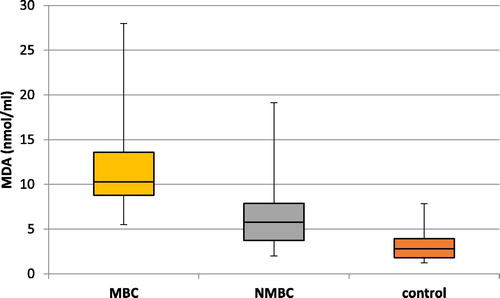
Table 2 Comparison of studied parameters in MBC vs. NMBC patients and control group [Median (Min-Max)].
Table 3 Relation between serum thioredoxin-1 (Trx-1), matrix metalloproteinase 9 (MMP-9) and malondialdehyde (MDA) serum levels with clinicopathological parameters in breast cancer patients.
Fig. 4 Positive correlation between serum thioredoxin-1 (Trx-1) level and matrix metalloproteinase-9 (MMP-9) level in all breast cancer patients.
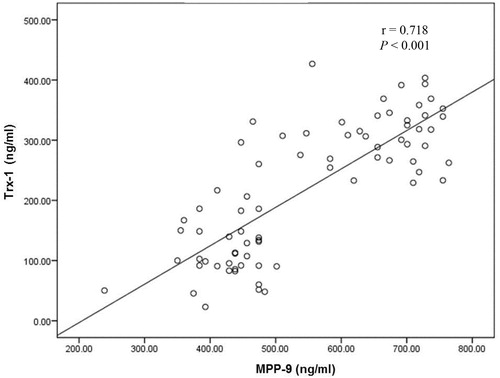
Fig. 5 Positive correlation between serum thioredoxin-1 (Trx-1) and cancer antigen 15-3 (CA15-3) levels (a) and serum Trx-1 and carcinoembryonic antigen (CEA) levels (b) in all breast cancer patients.
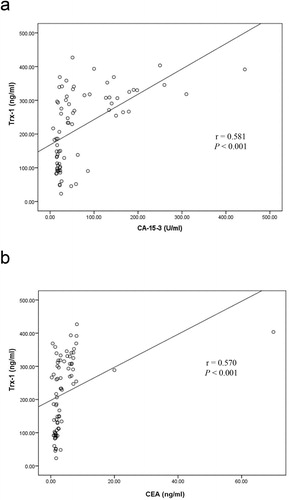
Fig. 6 Positive correlation between serum matrix metalloproteinase-9 (MMP-9) level and cancer antigen 15-3 (CA15-3) level (a) and serum MMP-9 level and carcinoembryonic antigen (CEA) level (b) in breast cancer patients.
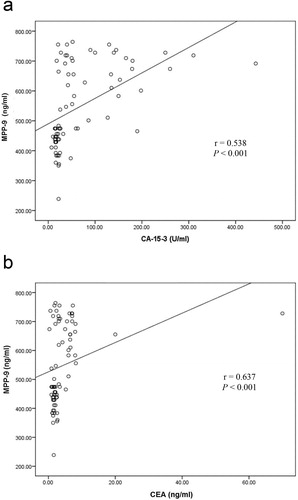
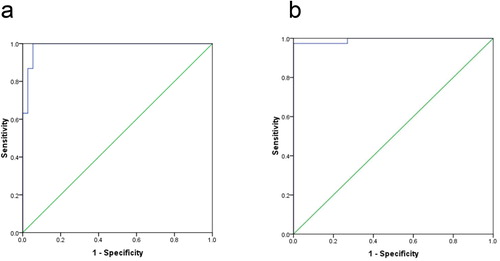
Fig. 7 Receiver operating characteristic curve (ROC) for serum thioredoxin-1 (Trx-1) level (a) and for serum matrix metalloproteinase-9 (MMP-9) level (b) for detection of breast cancer metastases.