
Figures & data
Table 1 Biological activities of training and test set derivatives.
Fig. 1 Schematic diagram of receptor (GABAAT).
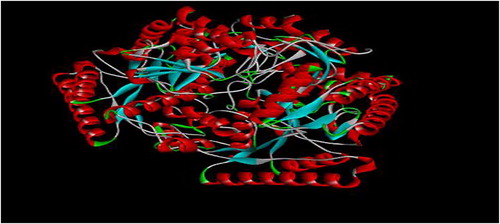
Fig. 2 QSAR procedure used in this work.
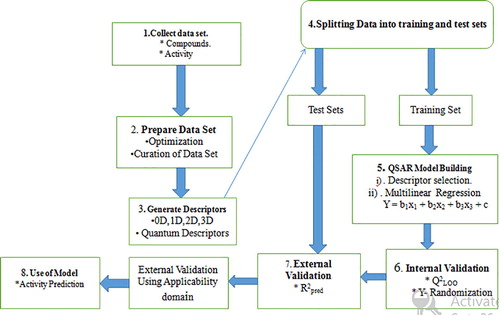
Table 2 Minimum recommended value of Validation Parameters for a generally acceptable QSAR model.
Table 3 List of physicochemical descriptors selected for this study.
Fig. 3 Plot of training and test sets of model 1.
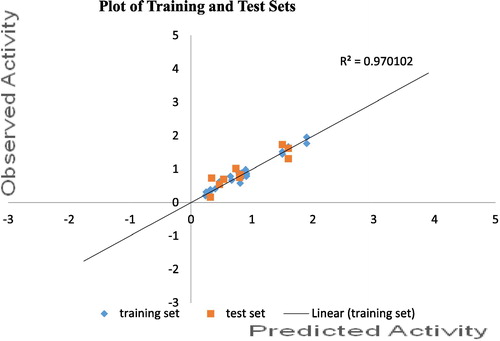
Table 4 Comparison of Observed, Predicted and Residual of Model 1.
Table 5 External validation of Model 1.
Table 6 Calculation of Predictive R2 of Model 4.10.
Table 7 Variance Inflation Factor (VIF) Statistic for the Descriptors in Model 1.
Fig. 4 3D and 2D of (A): GABAAT-Ligand 5a Complex. (B): GABAAT-Ligand 16a Complex. (C): GABAAT-Ligand 17a Complex. Ligand: H-bond interactions represented by green dashed lines: Hydrophobic interactions represented by red dashed line.
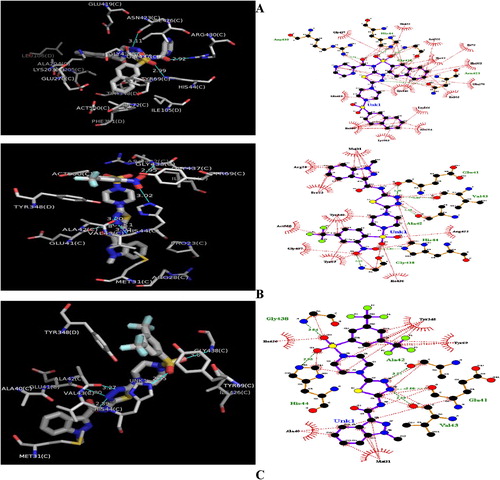
Table 8 GABAAT active site residues involved in docking interactions with the inhibitors and docking scores.