
Figures & data
Fig. 1 The dielectric permittivity . Changes in the permittivity
of the sham, 10 cGy and 2 Gy-irradiated groups as a function of frequency.
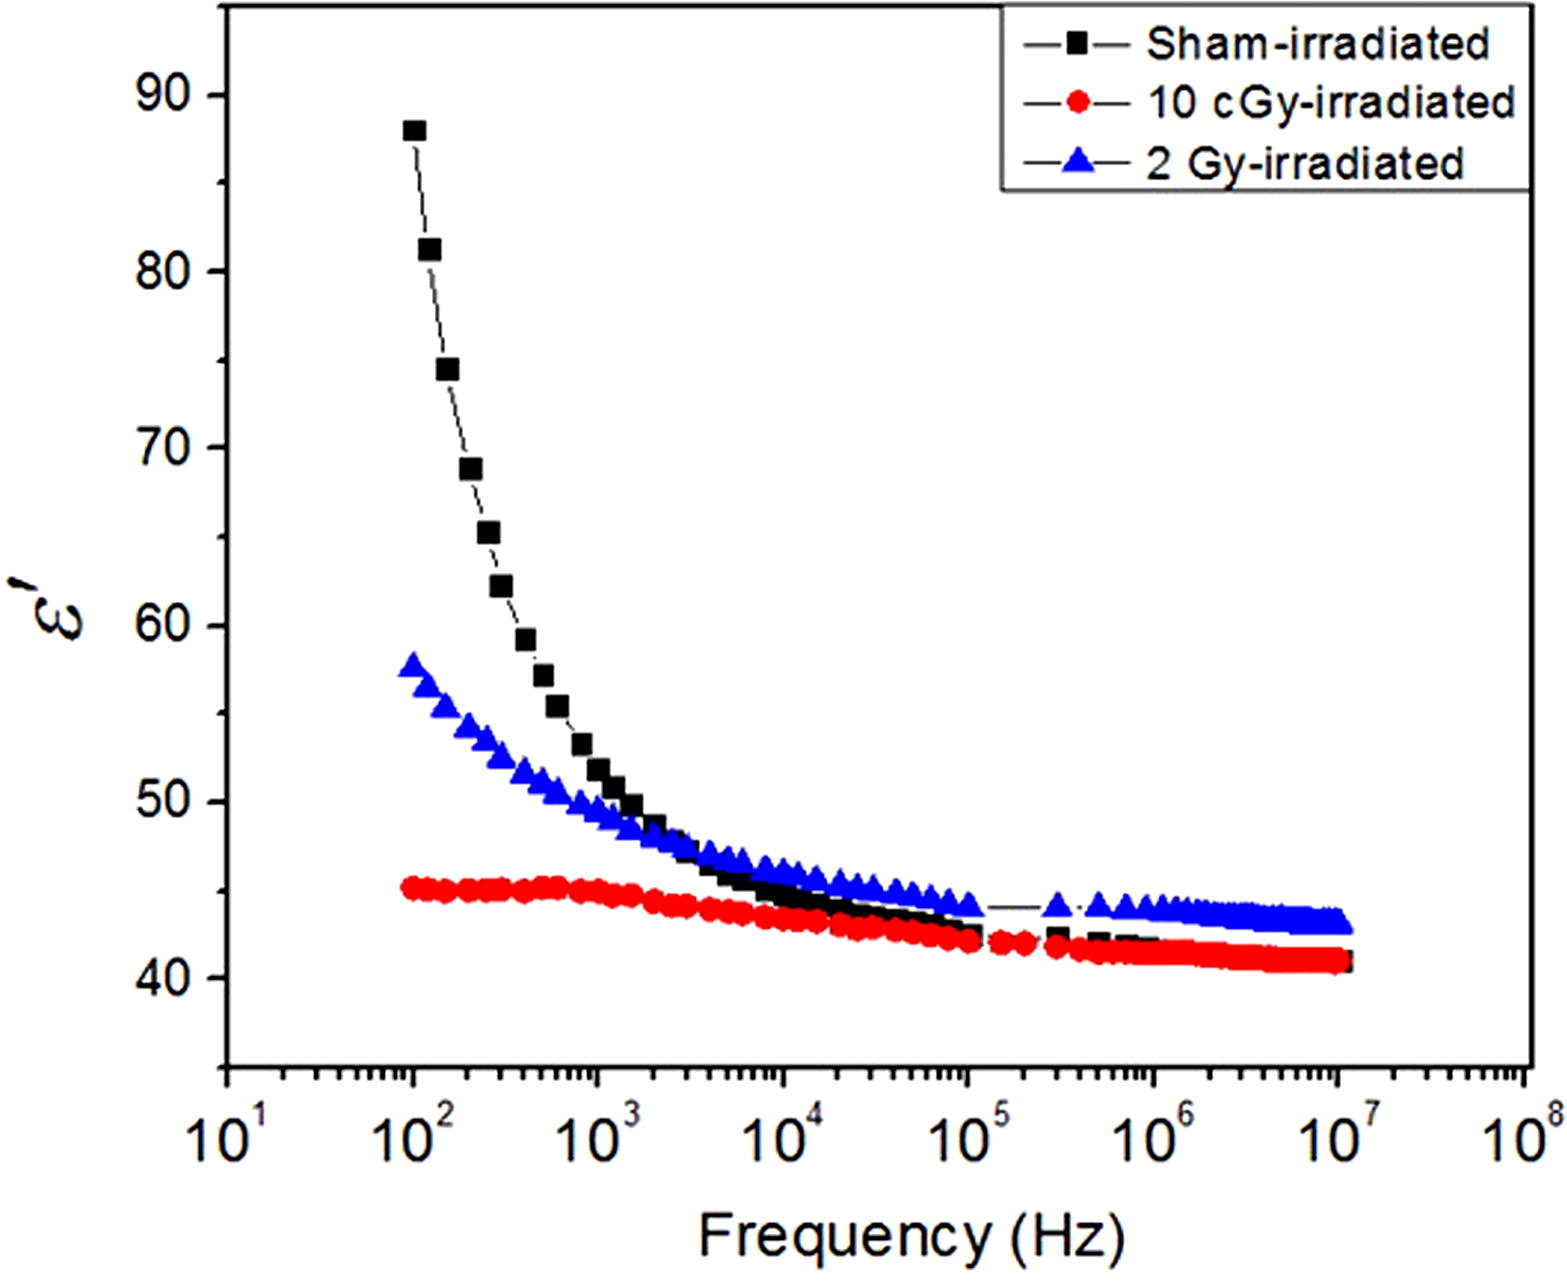
Fig. 2 The dielectric loss . Changes in the dielectric loss
of the sham, 10 cGy and 2 Gy-irradiated groups as a function of frequency.
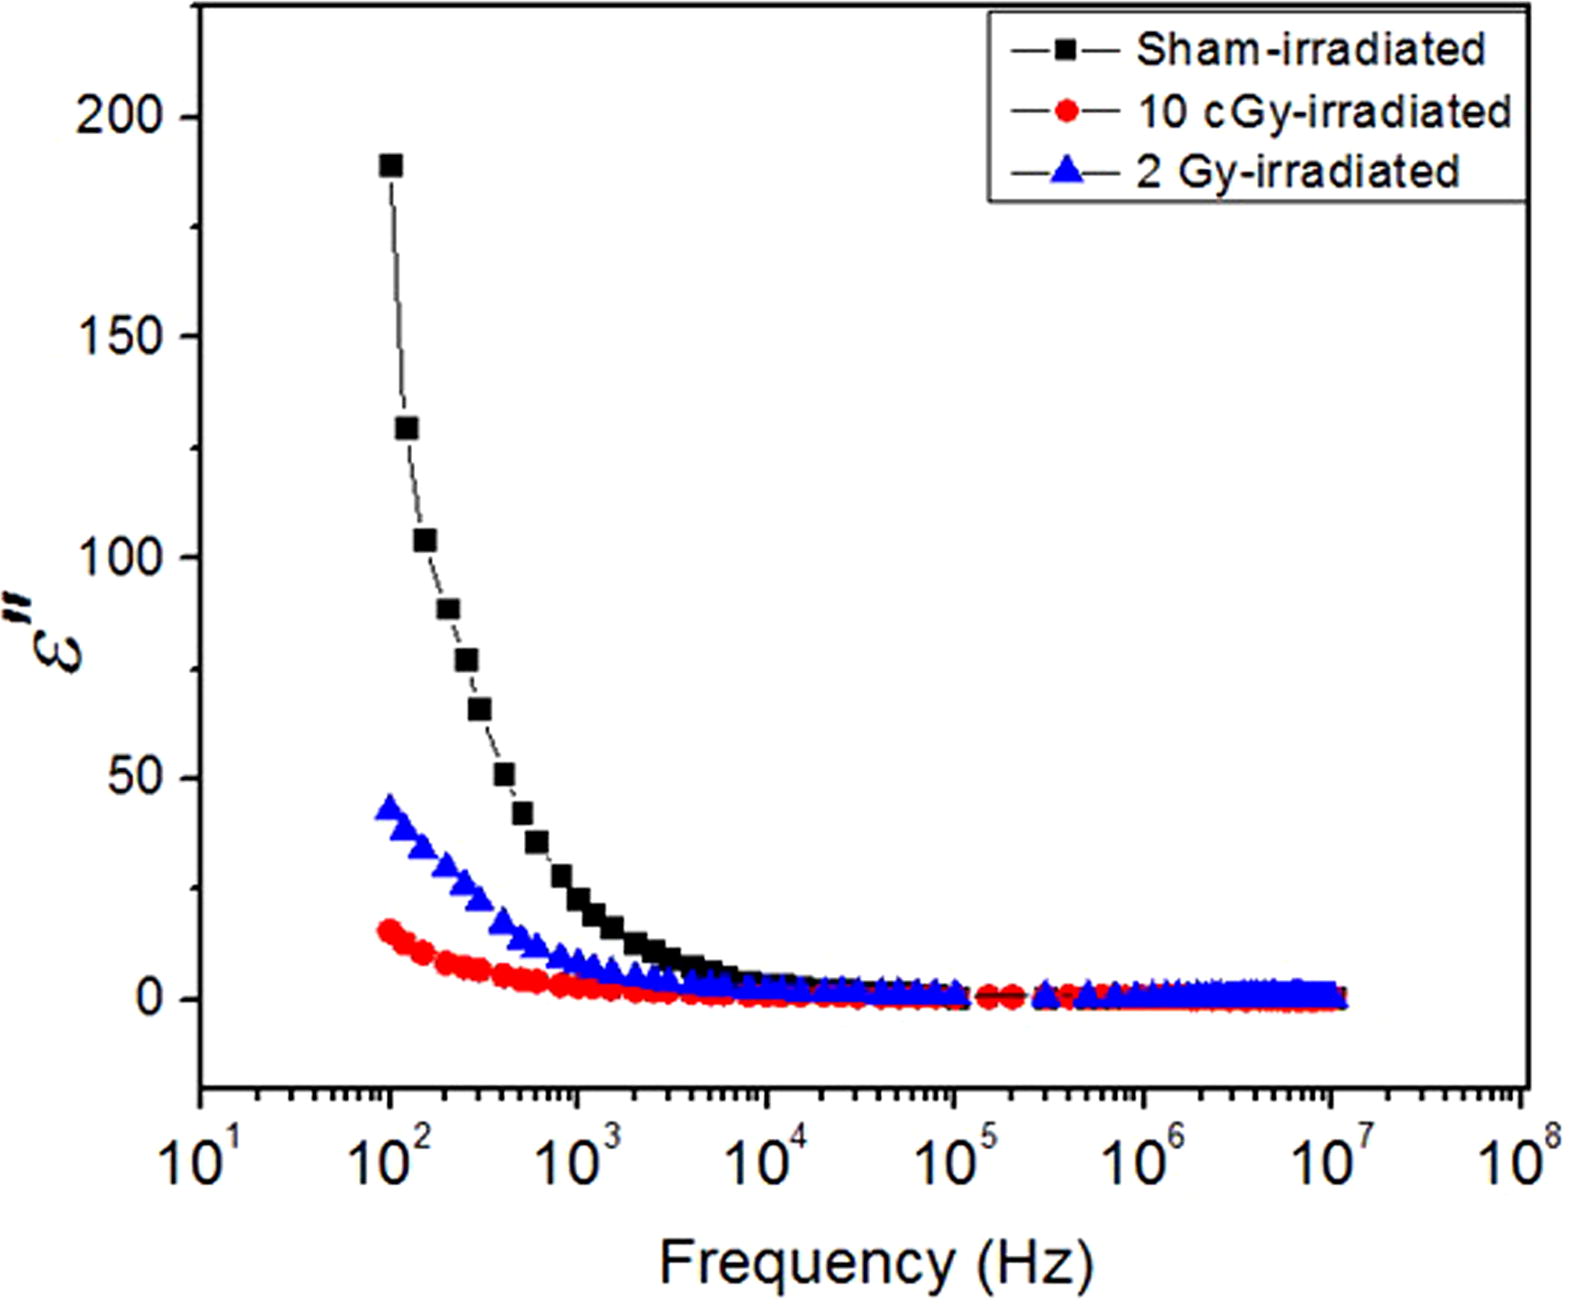
Fig. 3 The real part of the electric modulus . Changes in the real part of the electric modulus M′ of the sham, 10 cGy and 2 Gy-irradiated groups as a function of frequency.
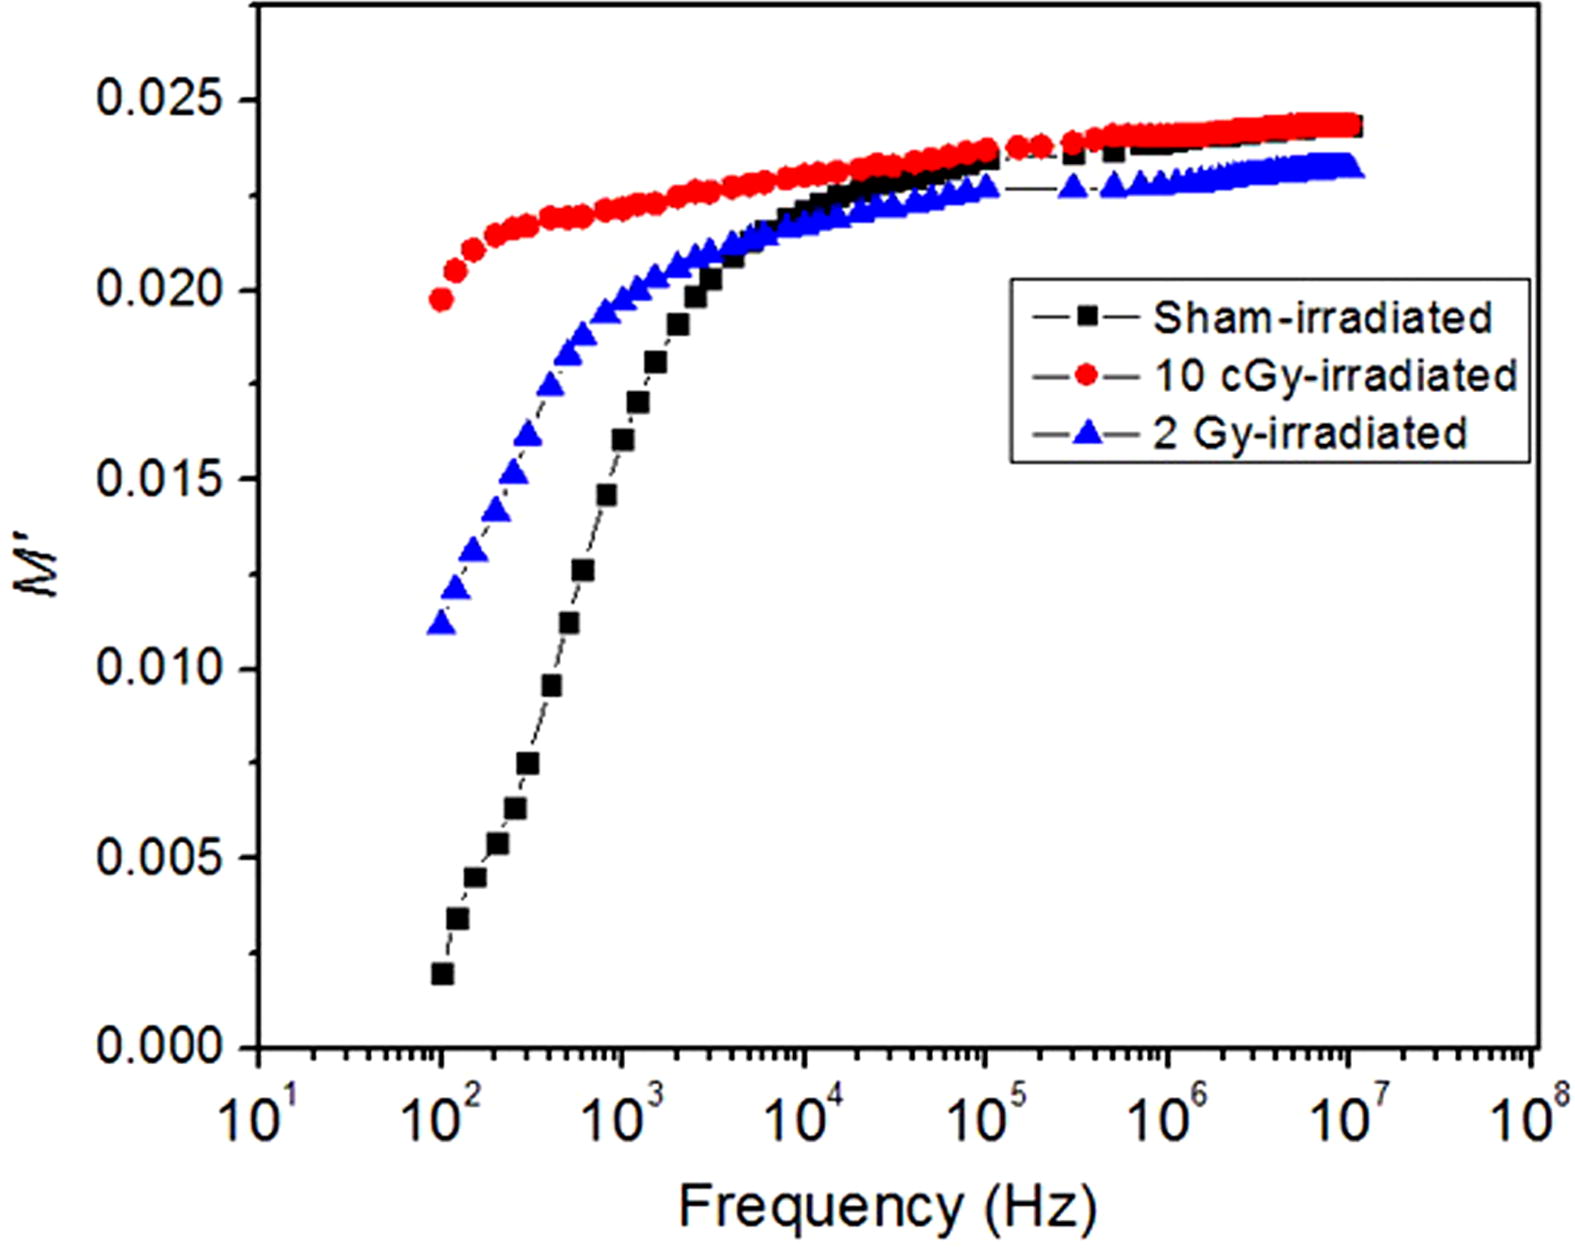
Fig. 4 The imaginary part of electric modulus . The imaginary part of electric modulus (M″) of the sham, 10 cGy and 2 Gy-irradiated groups measured versus frequency.
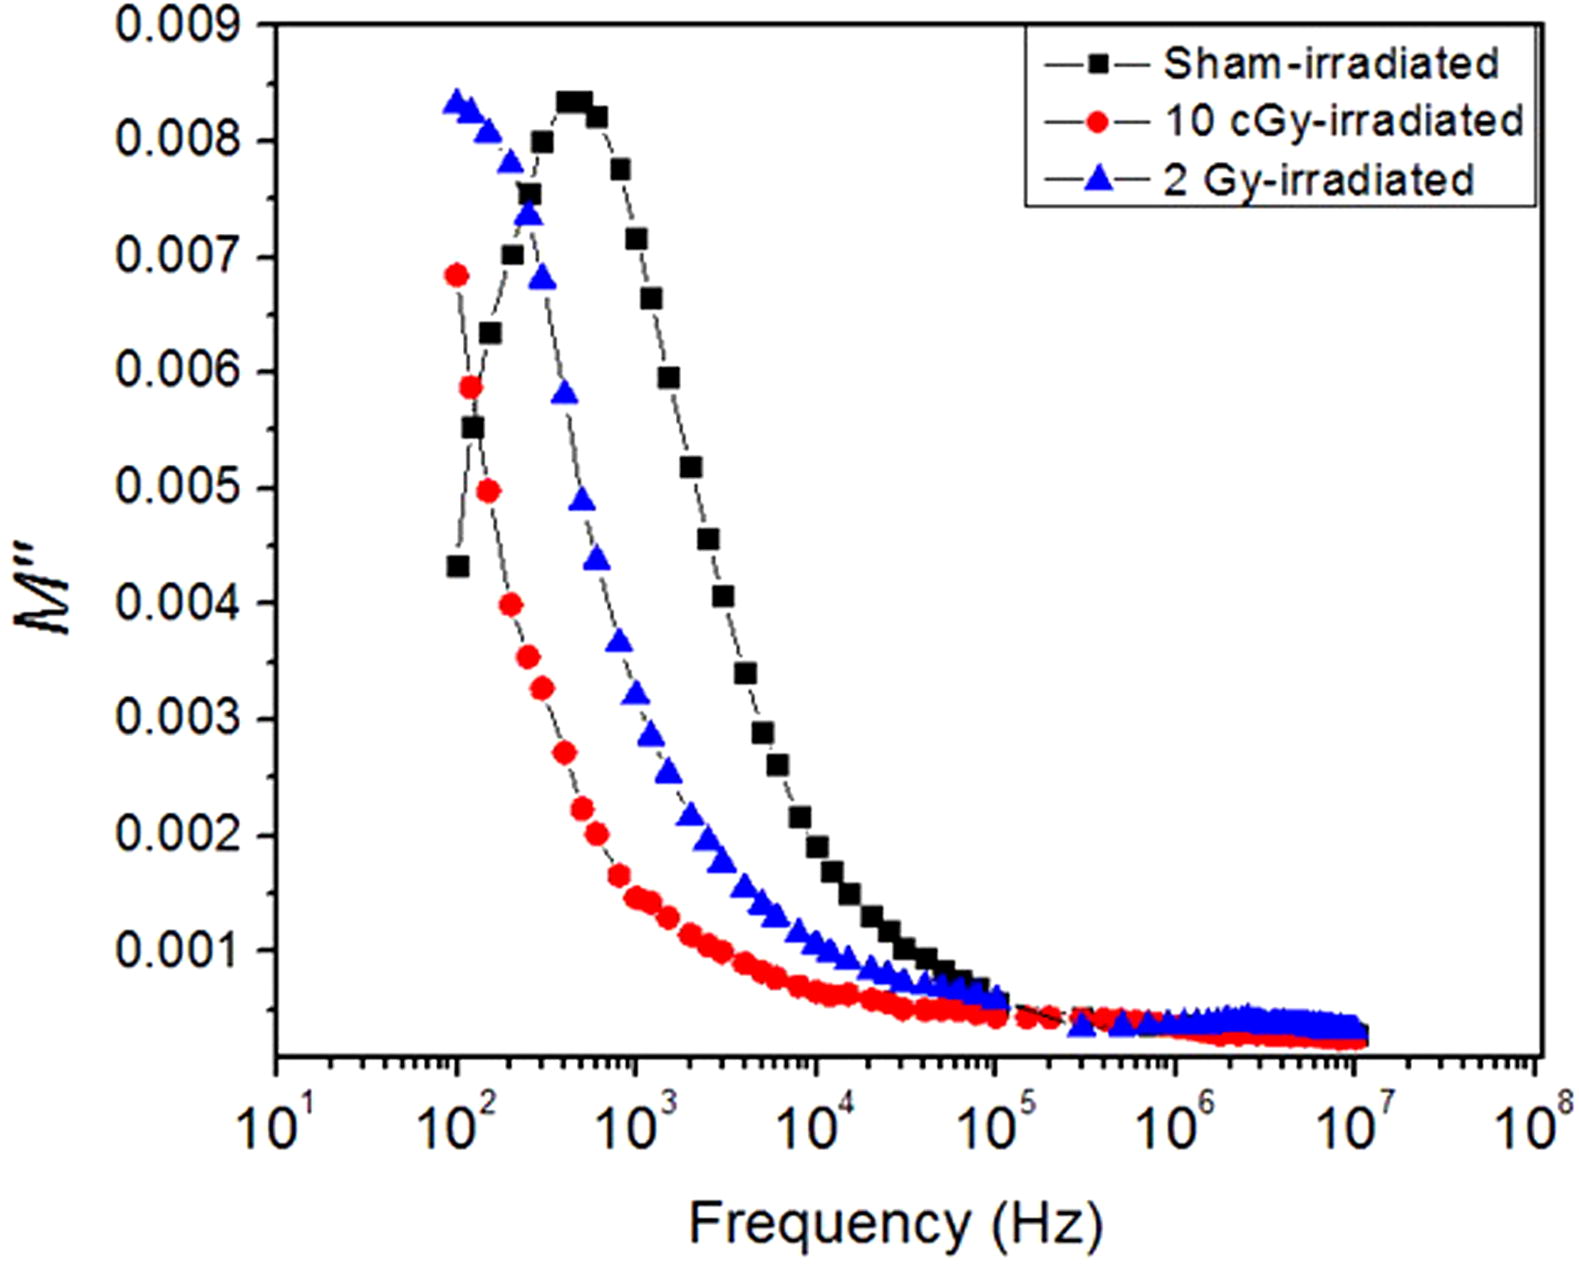
Fig. 5 The DC conductivity. Changes in the DC conductivity of the sham, 10 cGy and 2 Gy-irradiated groups as a function of frequency.
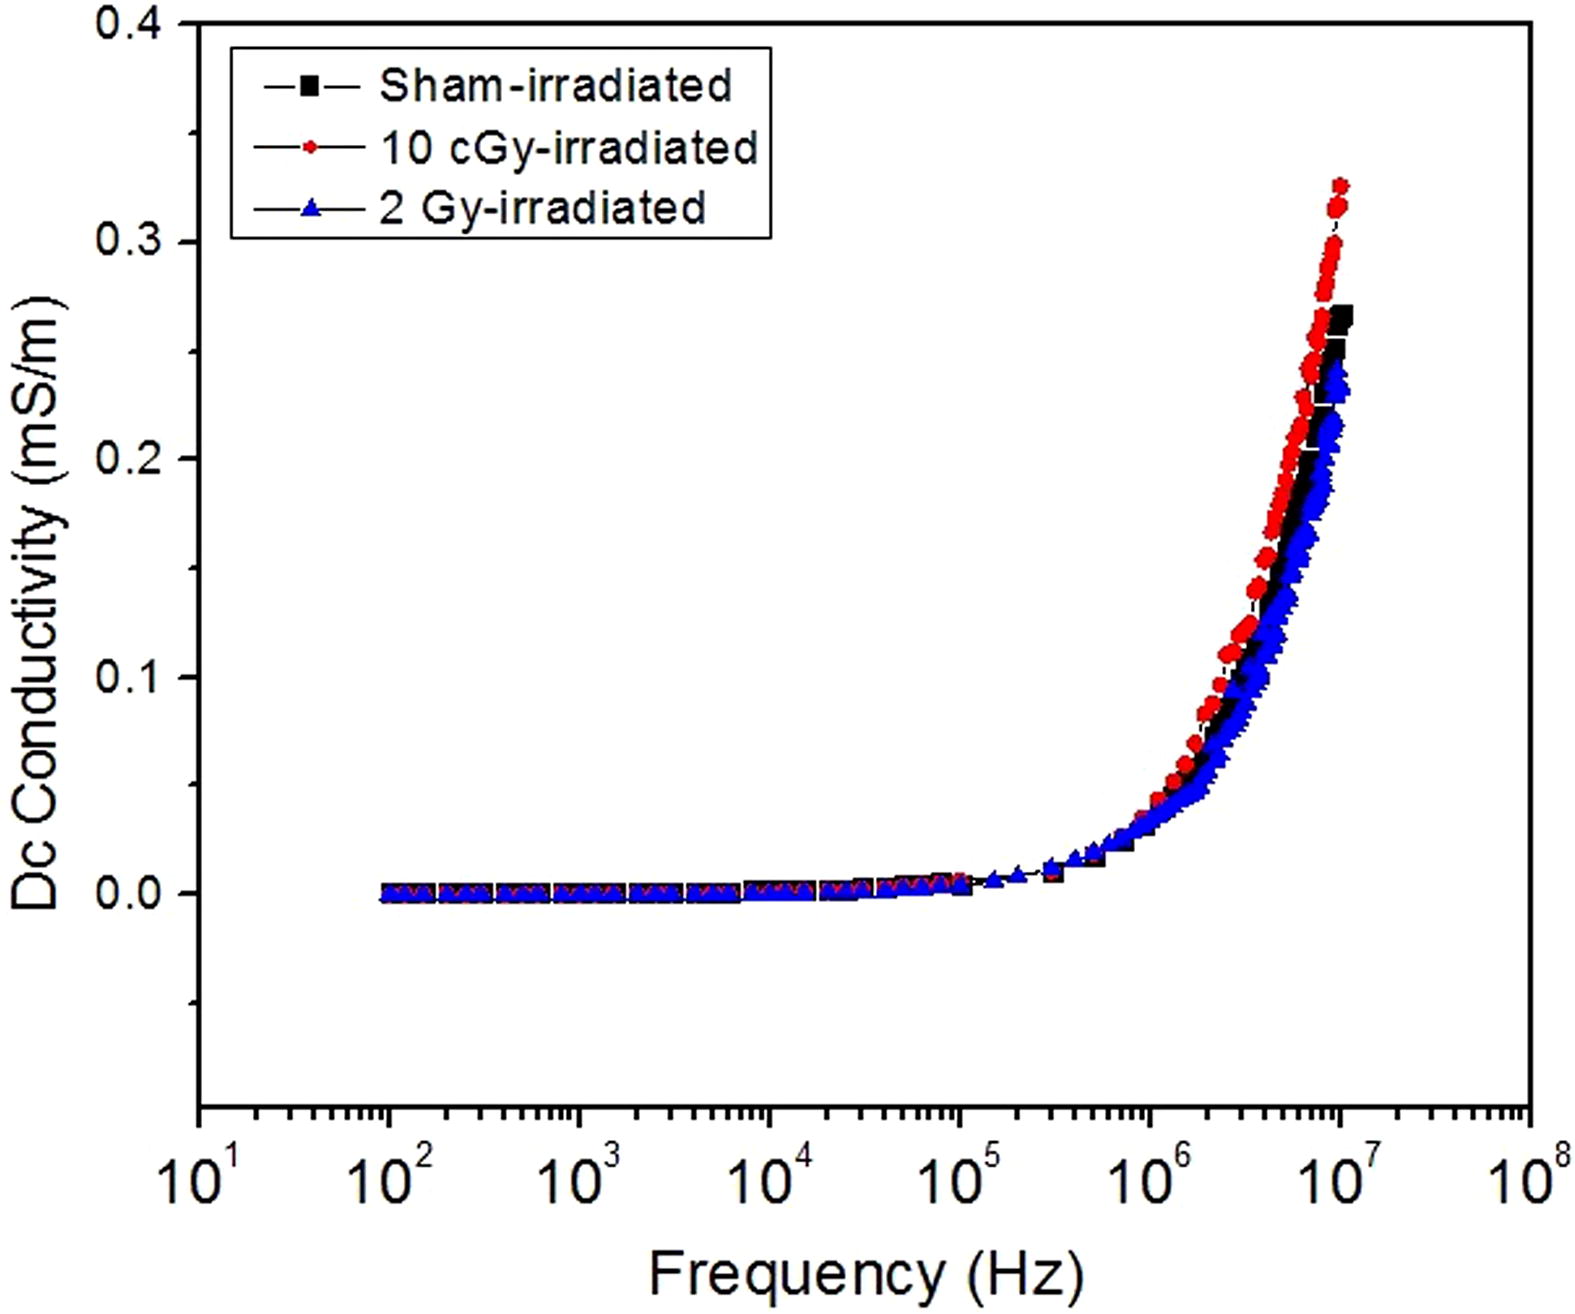
Fig. 6 FTIR spectra. The FTIR spectra of the rat lung of the sham, 10 cGy and 2 Gy-irradiated groups.
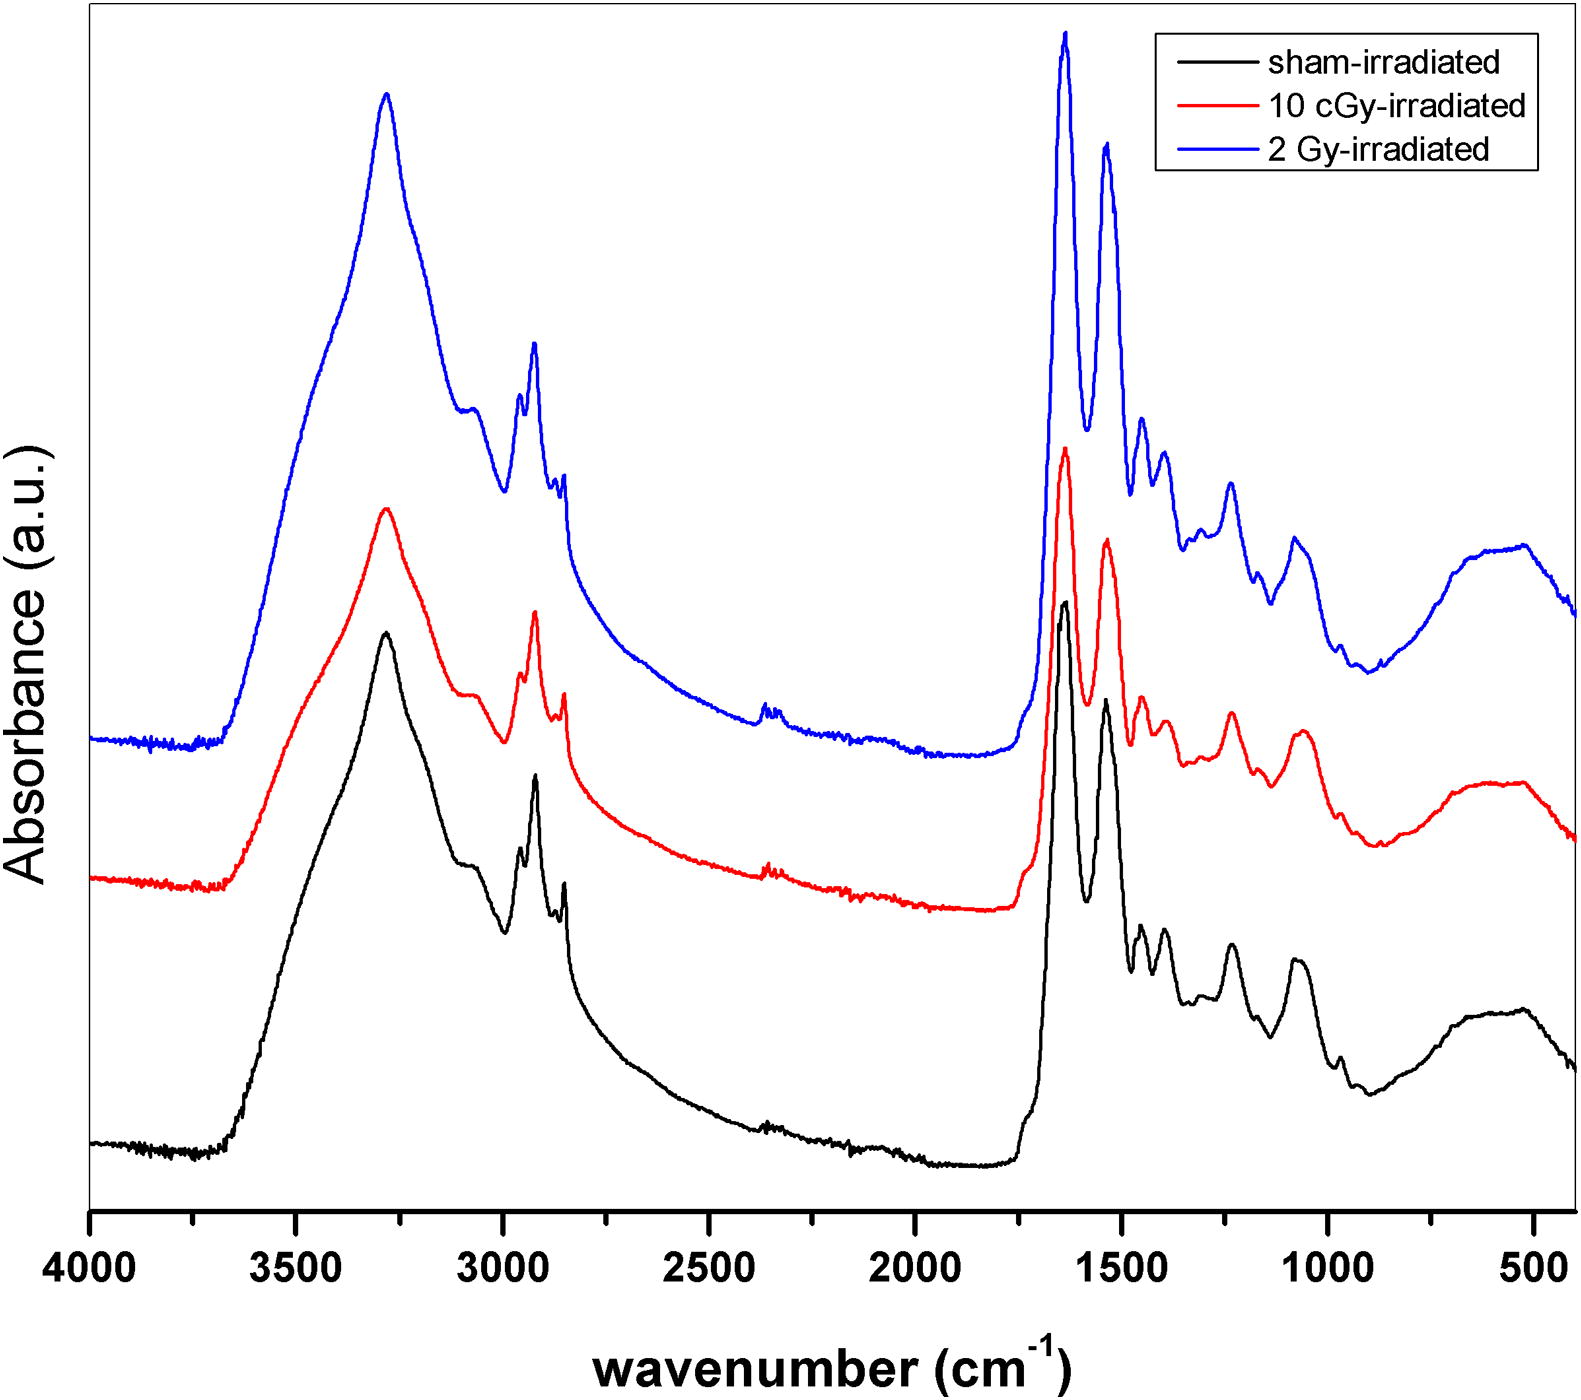
Table 1 Changes in the band position and full width at half maximum (FWHM) values of CH2 asymmetric stretching FTIR band of sham, 10 cGy and 2 Gy-irradiated groups.