Figures & data
Table 1 Mean values ± standard error of ICs (µg/ml) presenting the cytotoxic activity of the 2 crude extracts, ZCE and ZCW on Pas.
Fig. 1 Lipolytic activity of the crude extracts on MAs after 3 days of treatment. (A) – Image of lipid-droplets, stained with ORO, scale bar = 50 µm. Horizontal values indicated the 5-dilutions concentrations of the crude extracts in µg/ml. Relative percentage of lipid content by ORO colorimetric assay and relative percentage number of viable-cells, in comparison to those of the control group at 0 µg/ml, were presented on (B) – ZCE and (C) – ZCW in comparison to that of the media control (0 µg/ml). Differences among the means were not significant (p ≤ 0.05).
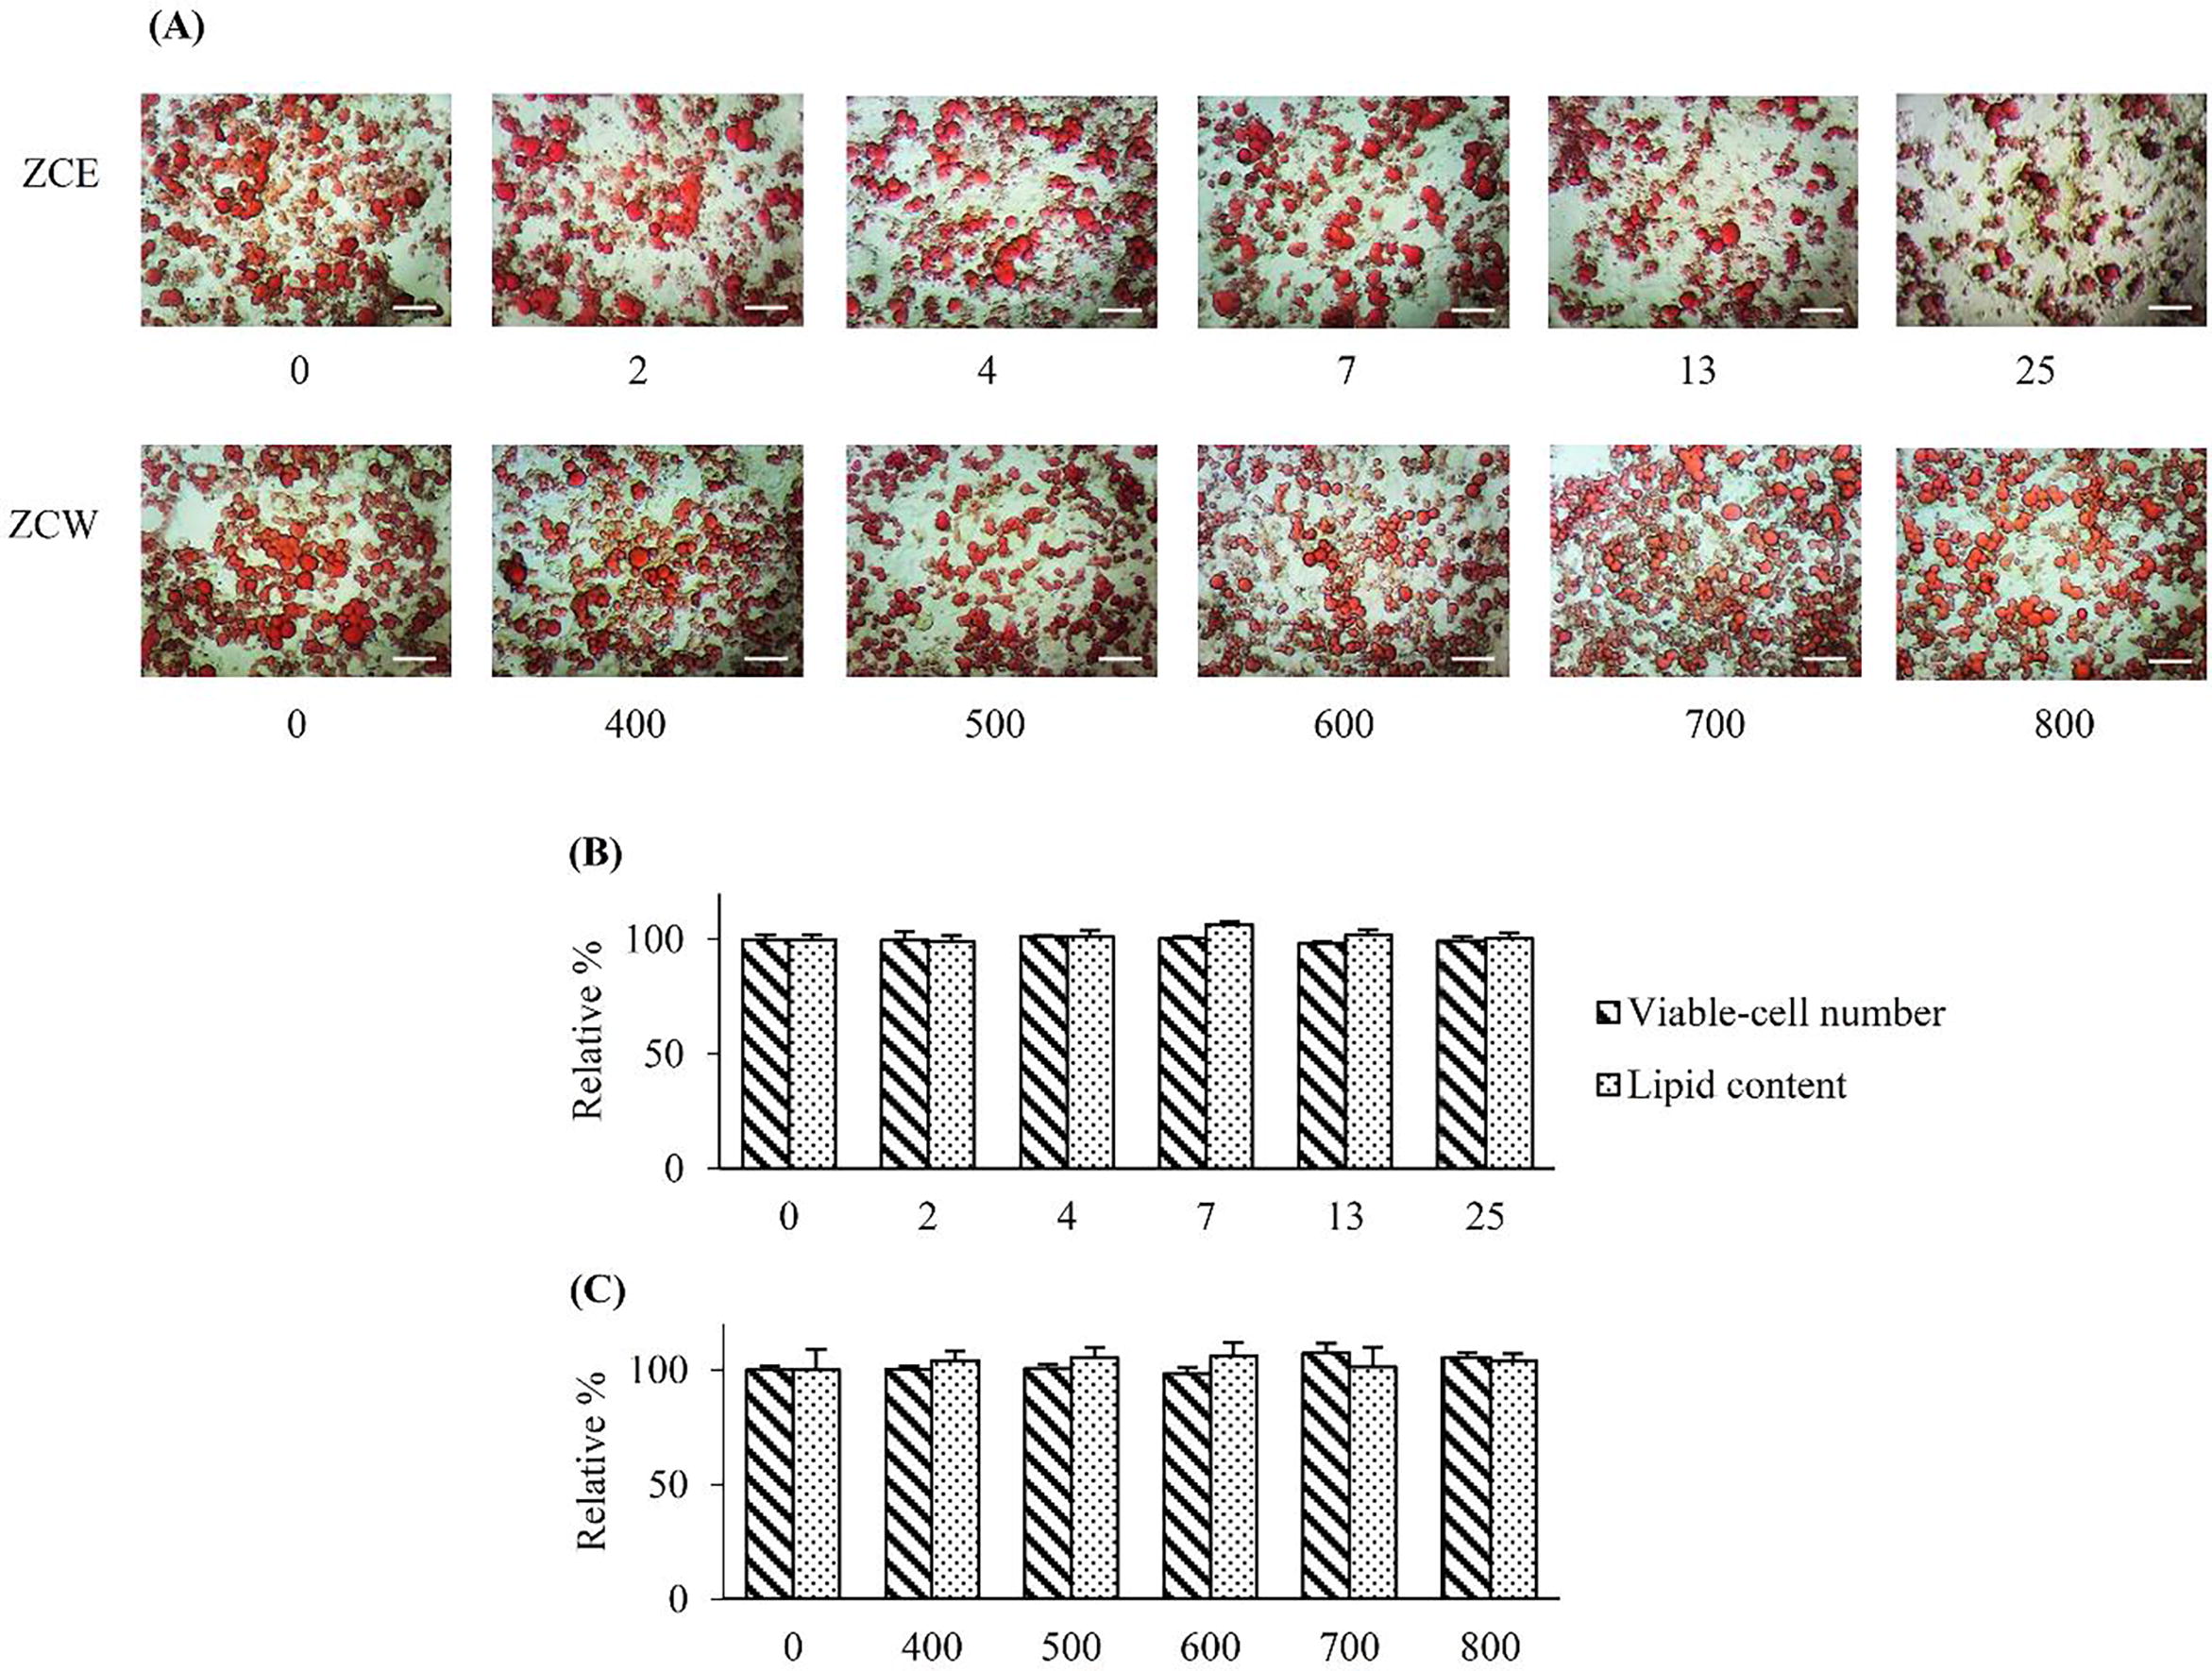
Fig. 2 Anti-adipogenic assay of the crude extracts on MAs after induction for 14-days. (A) – the fresh cells (upper row) and the cells with ORO staining (lower row) (scale bar = 50 µm). In SA/nt, black and white arrows indicated SSA and SIA cells respectively (see text). (B) – Relative number of viable-cells and the lipid content in compared with MA/nt. The exposed groups of DA/ZCE and DA/ZCW at 25 and 800 µg/ml respectively. The significant difference (p ≤ 0.05) of the means was shown as a, b, c and d on top of the histograms.
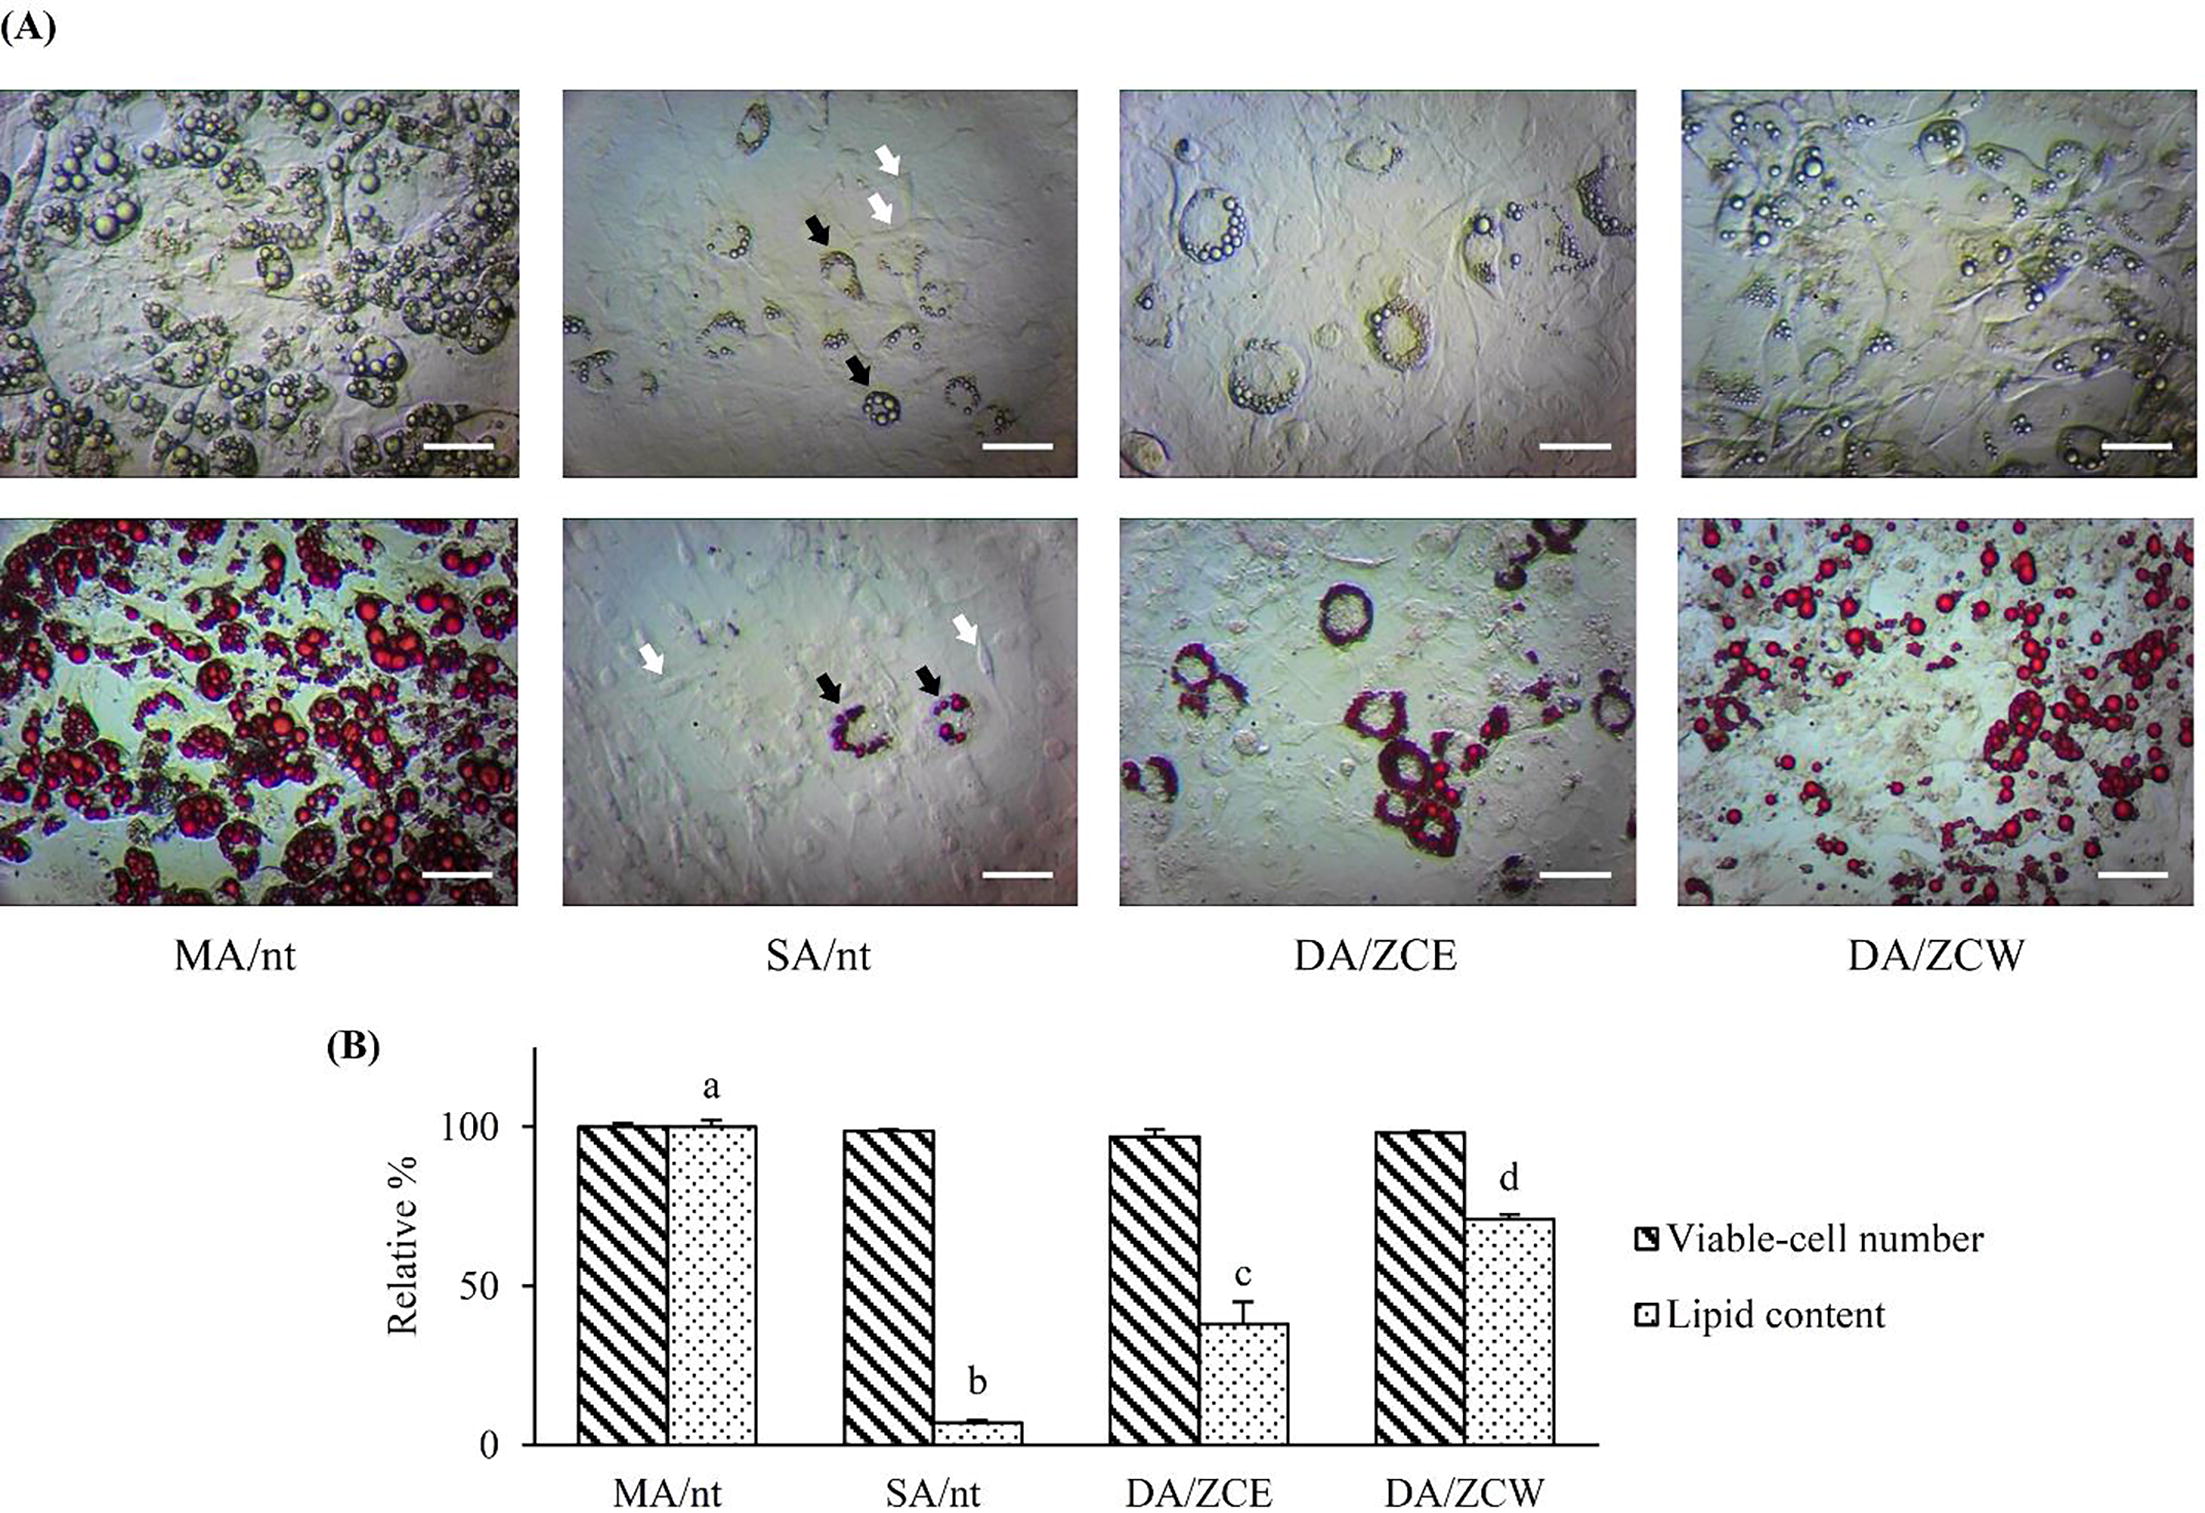
Fig. 3 Expression of adipogenic-related genes on the 4 cell-groups (abbreviation, see text). (A) –adipocyte differentiation genes, (B) – glucose uptake genes, (C) – lipid metabolism genes and (D) – fatty acid oxidation genes. The significant (p ≤ 0.05) of mRNA expression of each gene is shown in relation to MA/nt (control) cells.
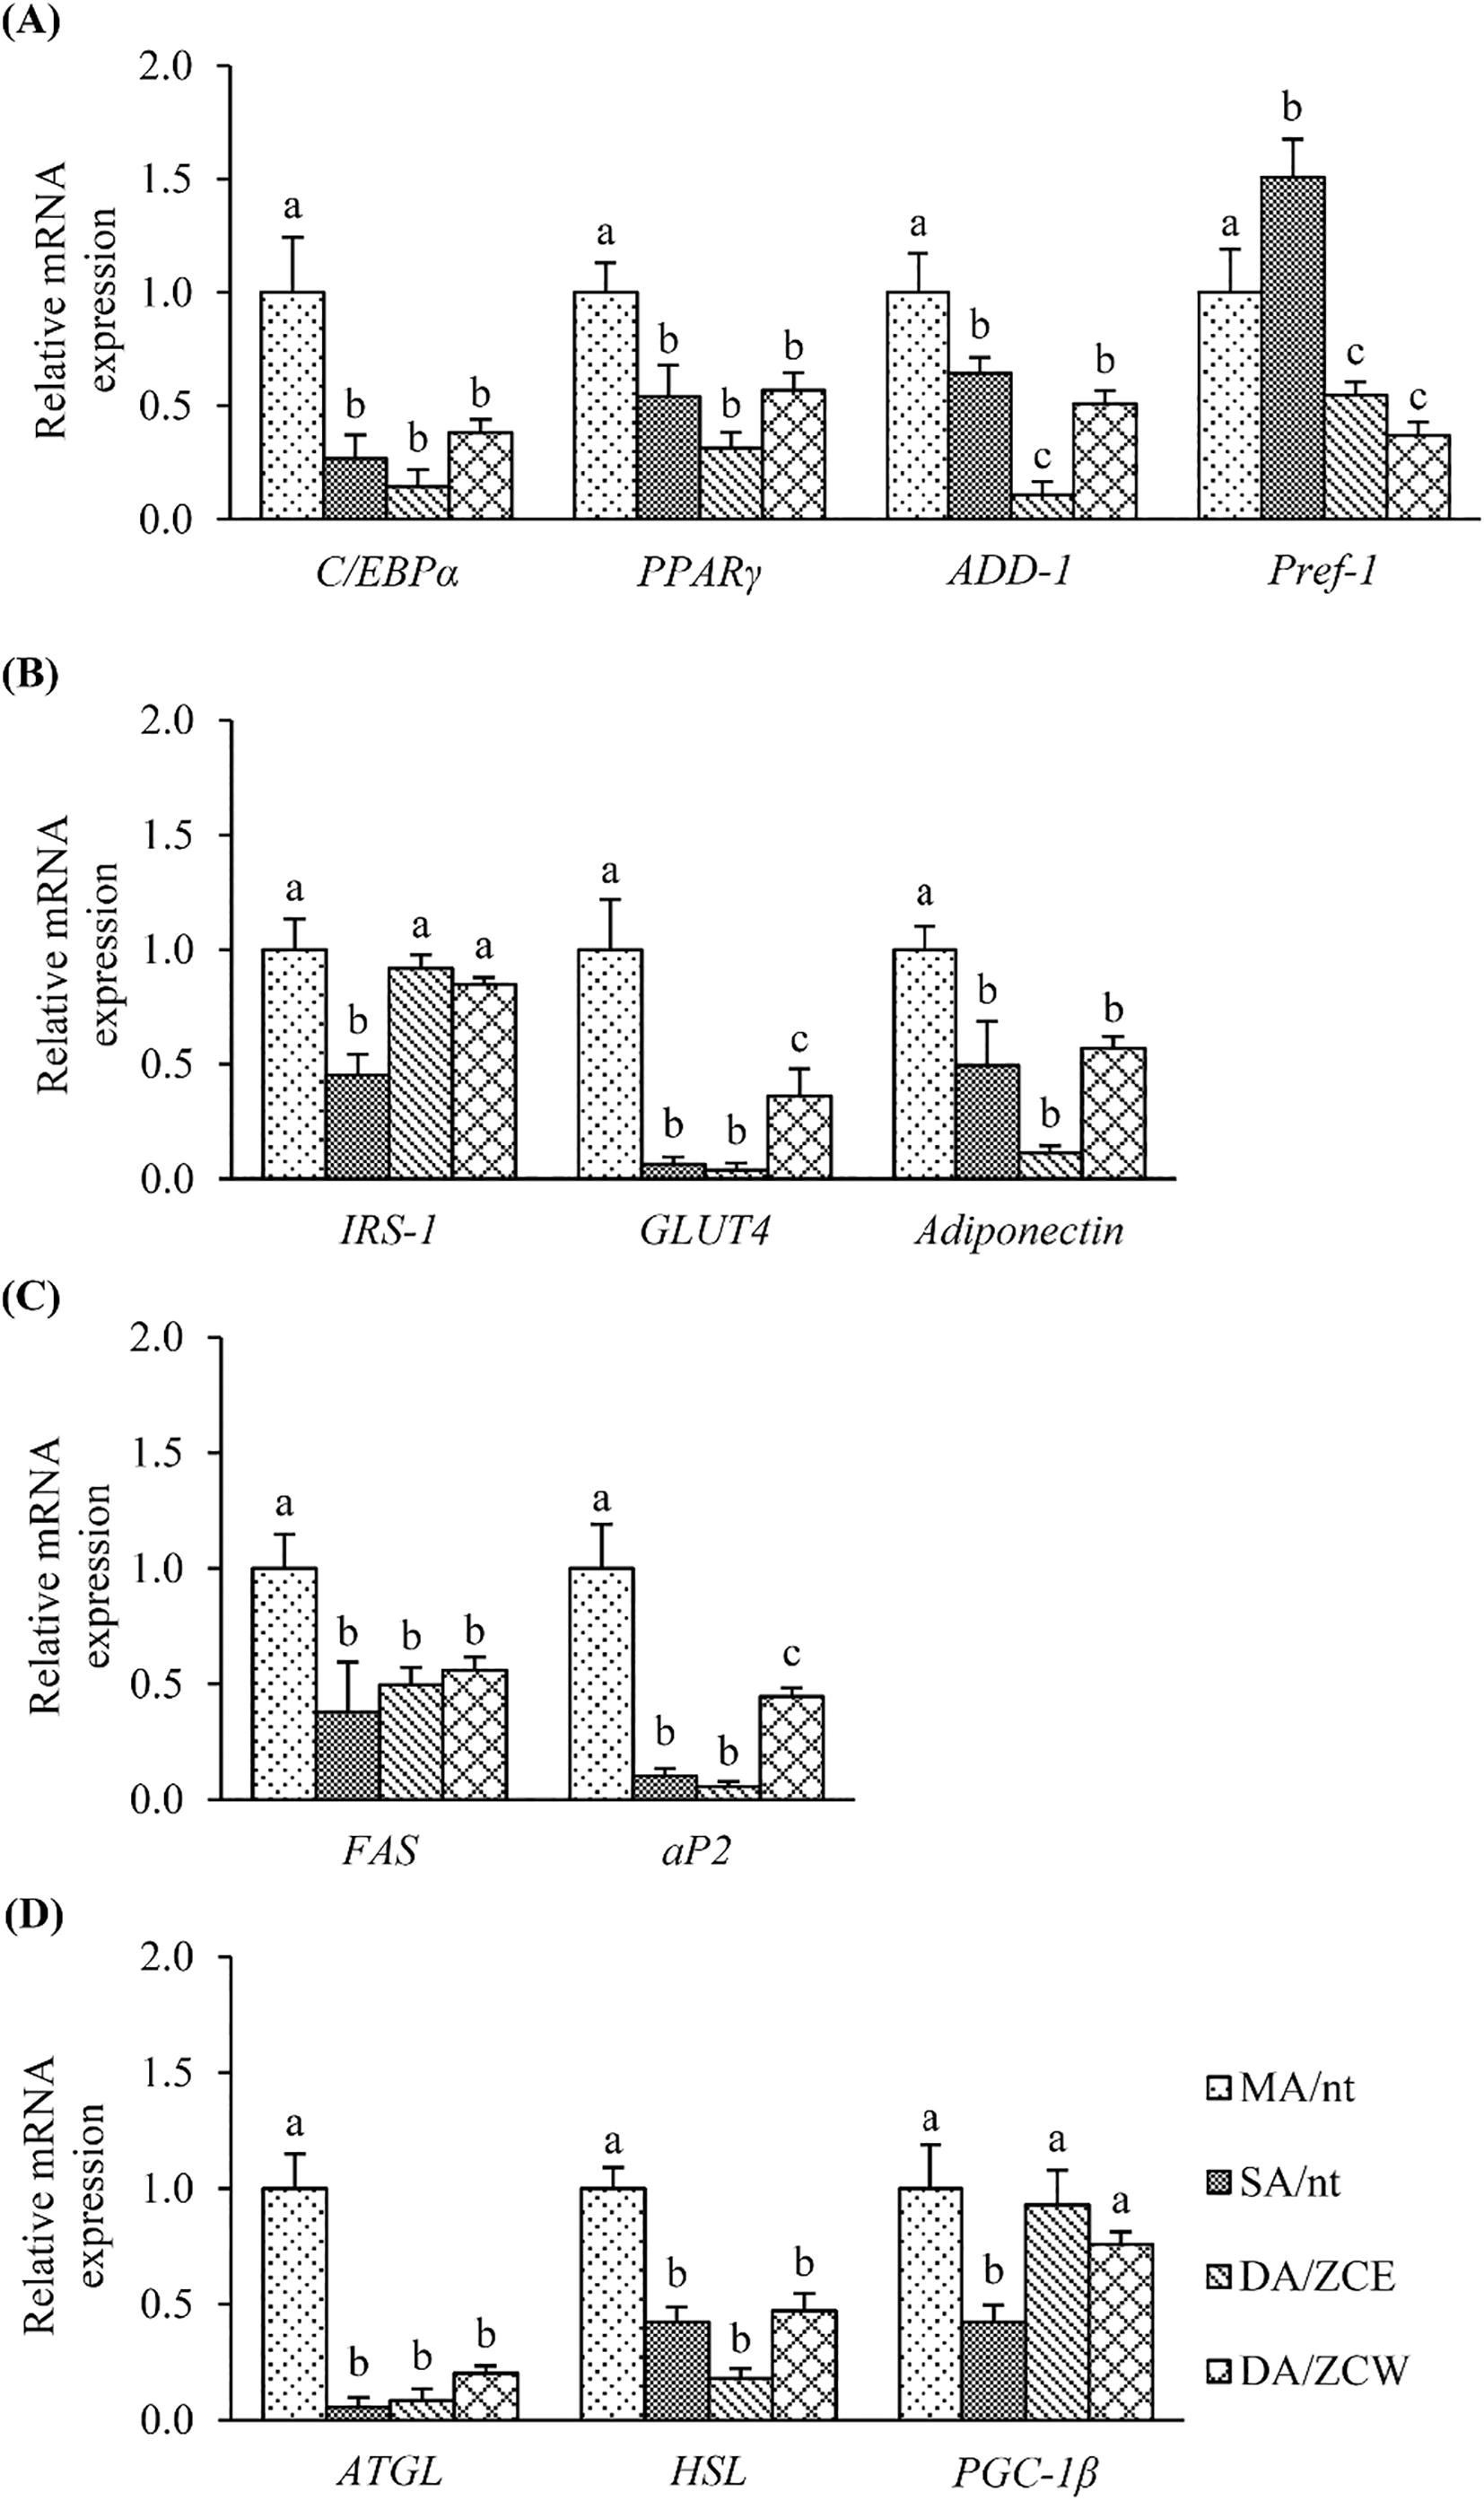
Fig. 4 1H NMR spectrum (CD3OD) of the ethanol crude extract of ZCE. Anomeric protons peaks of glucose were shown at 5.4 and 4.5 ppm, with the resonances of hydroxyl groups’ protons at 3.13–4.18 ppm. Aromatic protons of metabolite majorities appeared at 6.7–7.1 ppm. Olefinic protons of phenylbutanoid compound were at 6.0–6.5 ppm.
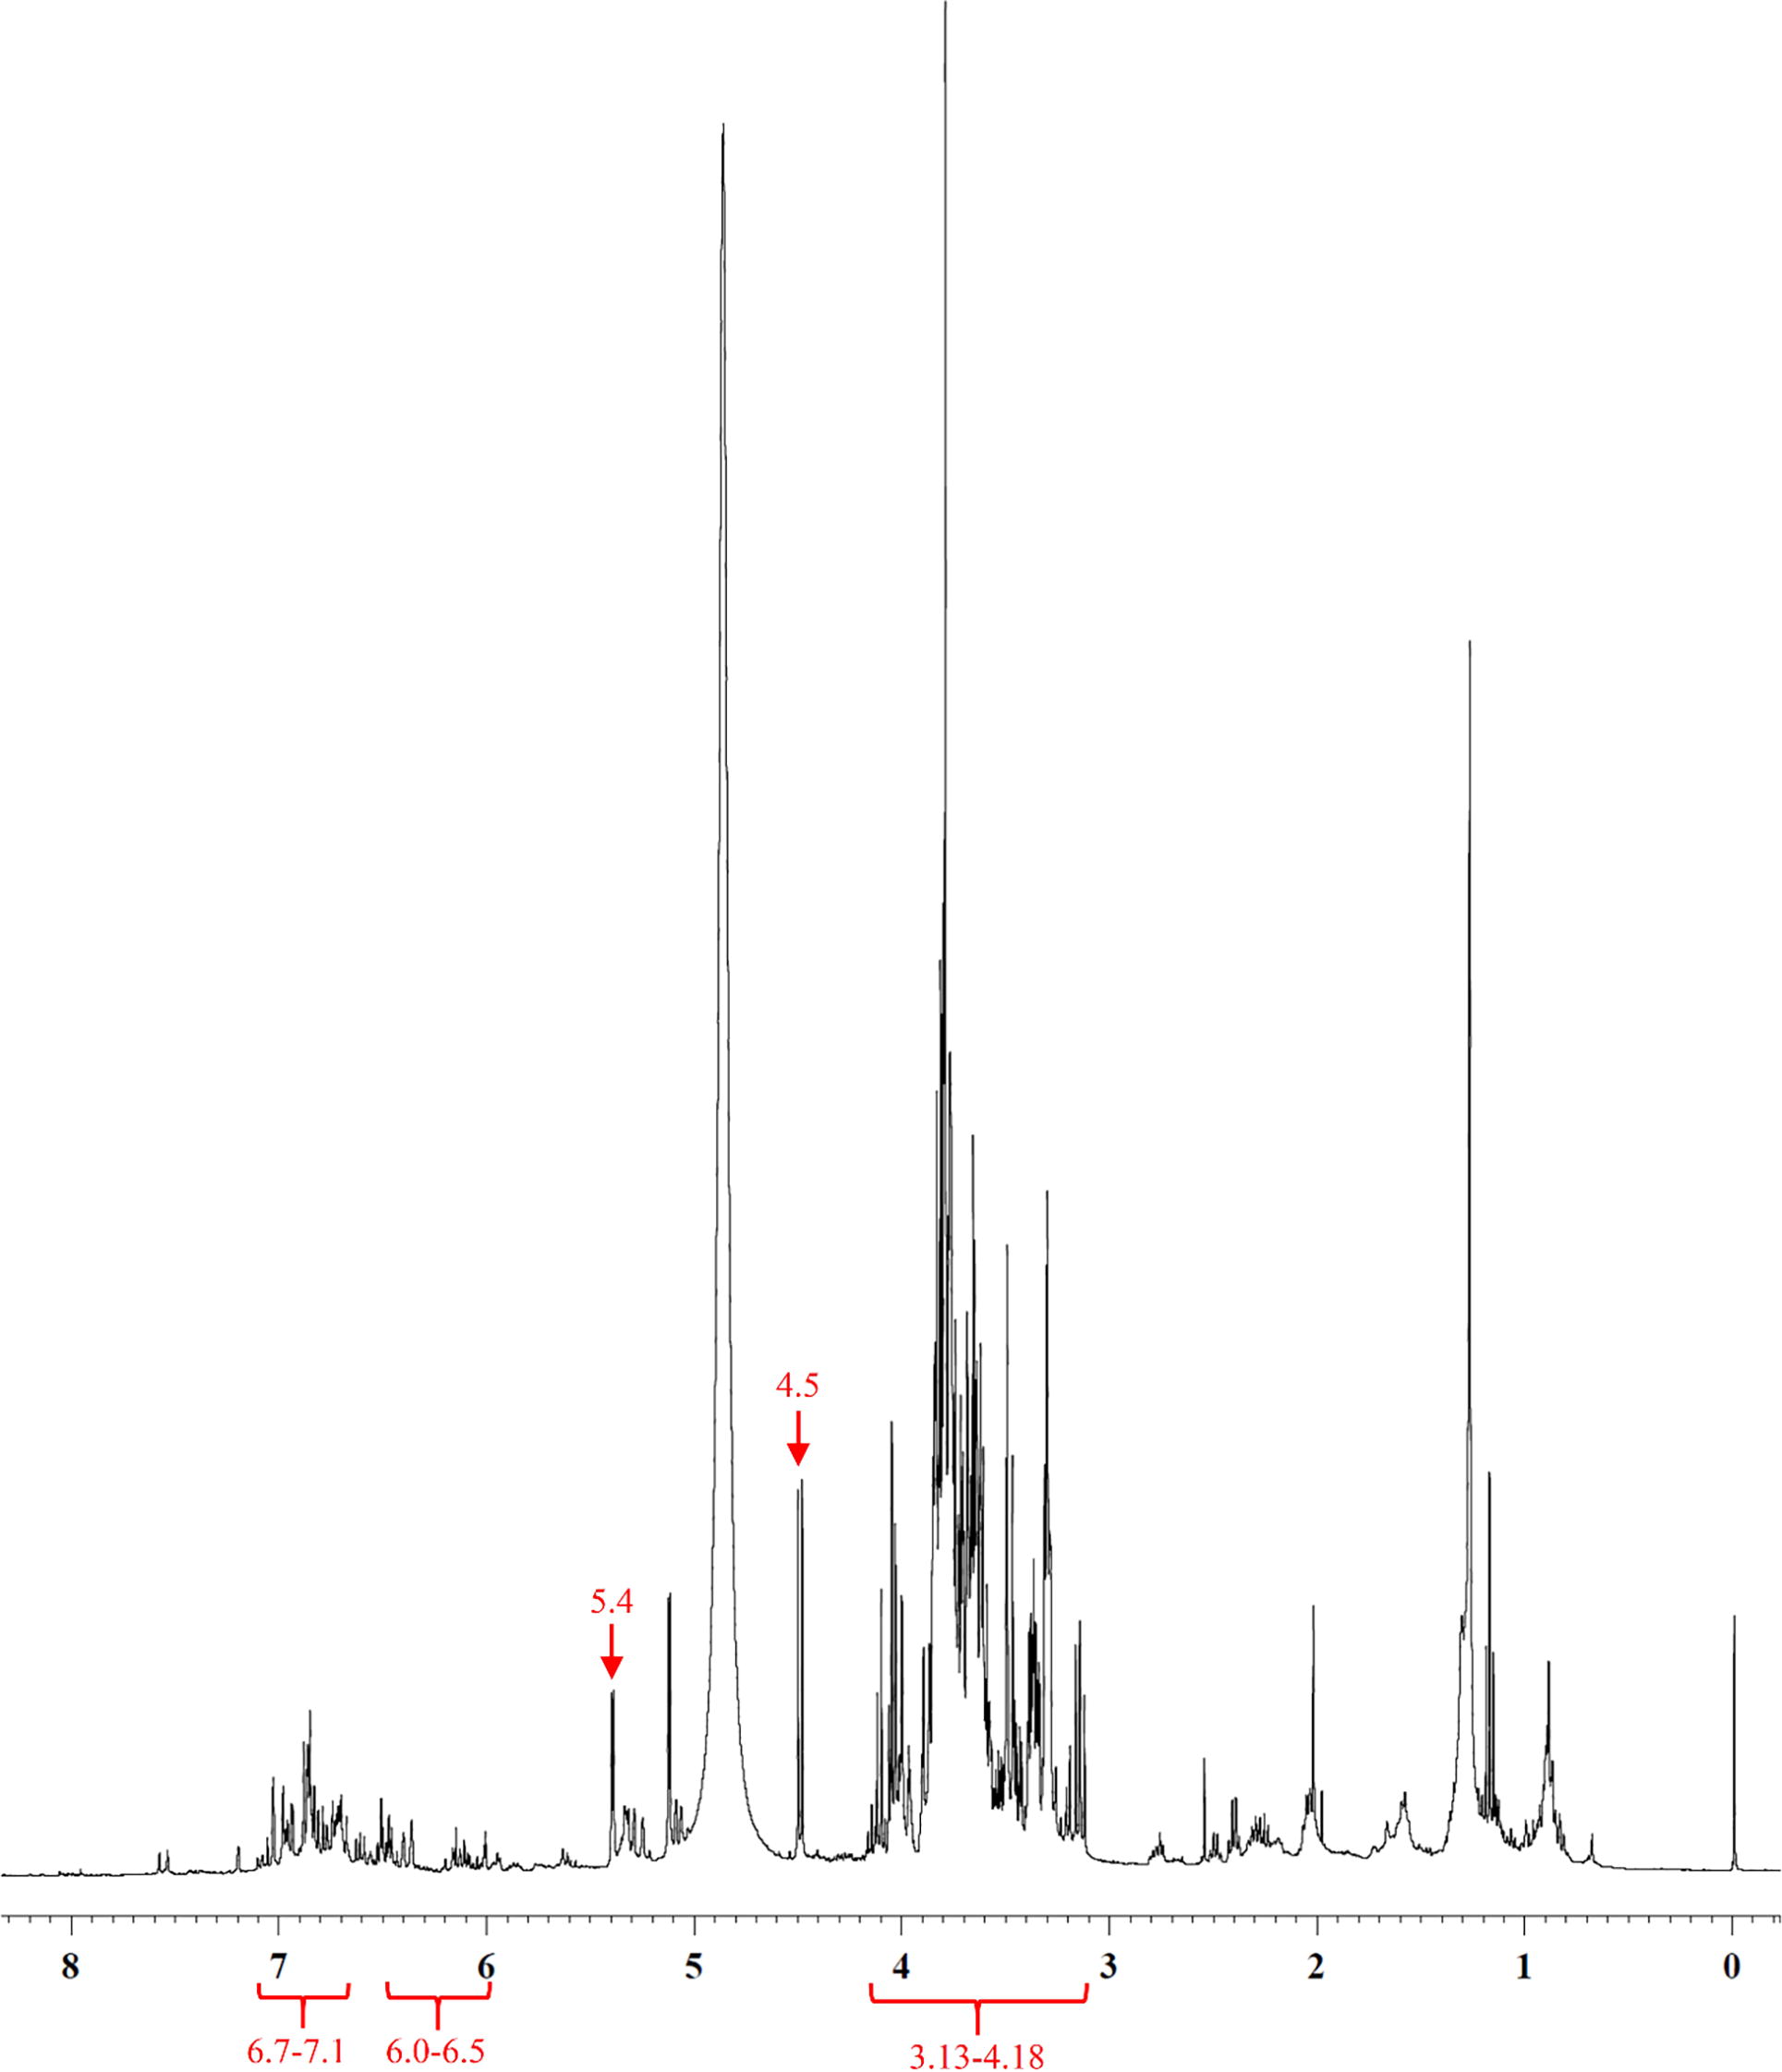
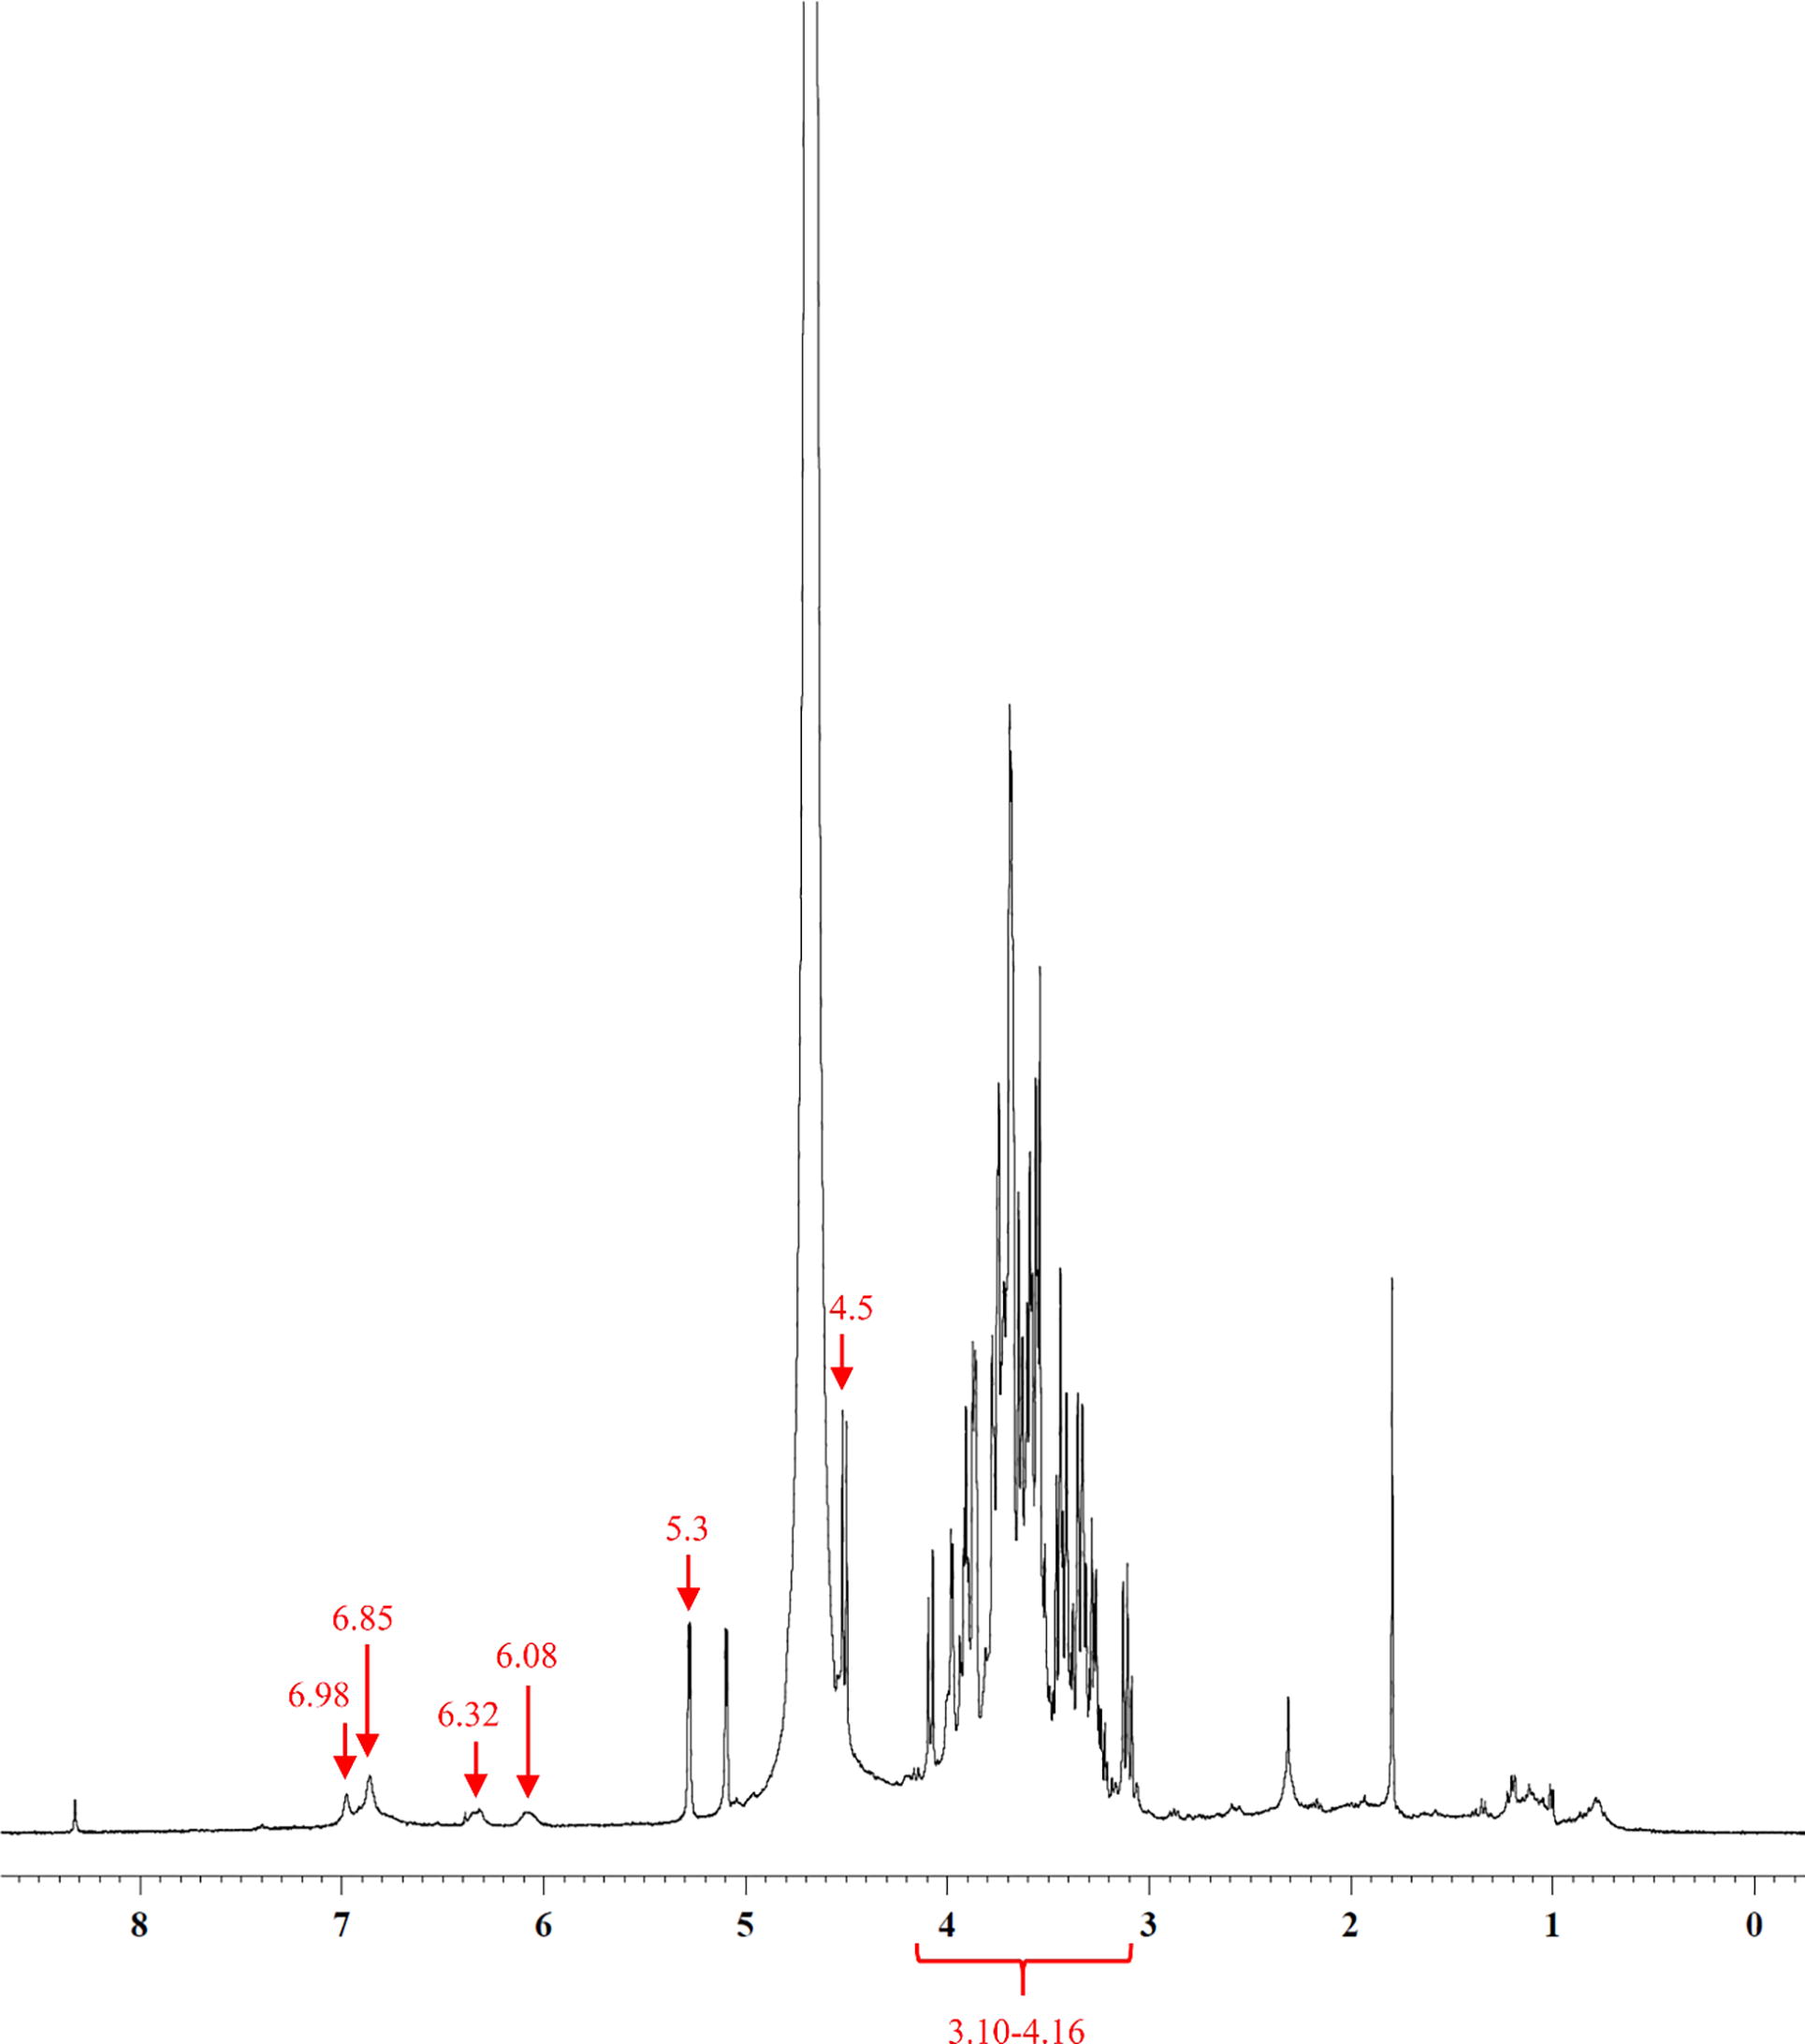
Fig. 5 1H NMR spectrum (D2O) of ZCW. Anomeric protons peaks of glucose were shown at 5.3 and 4.5 ppm for α-form and β-form respectively, with the resonances of hydroxyl group protons at 3.10–4.16 ppm. Aromatic protons of metabolite majorities appeared at 6.85 and 6.98 ppm. Olefinic protons of phenylbutanoid compound were at 6.08 and 6.32 ppm.