Figures & data
Table 1 Chemical composition of sand and cement, wt.%.
Fig. 2 Water absorption of consolidated sand mixed with (1 OD) of bacterial cells and (1 M) equimolar of urea/calcium chloride, calcium acetate or calcium nitrate after four treatments.
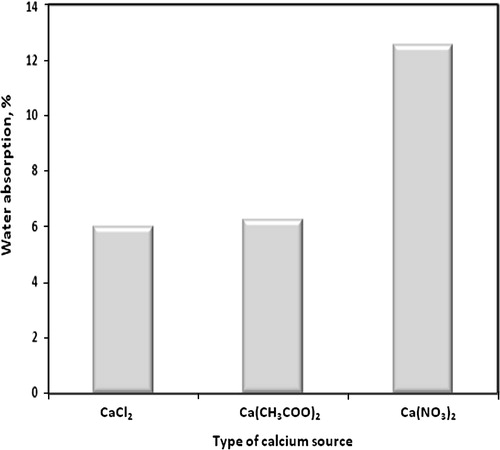
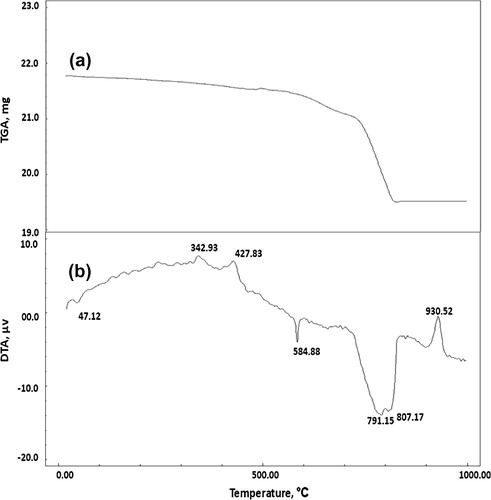
Fig. 5 TGA and DTA thermograms of consolidated sand mixed with (1 OD) of bacterial cells and (1 M) equimolar of urea/calcium chloride after four treatments.
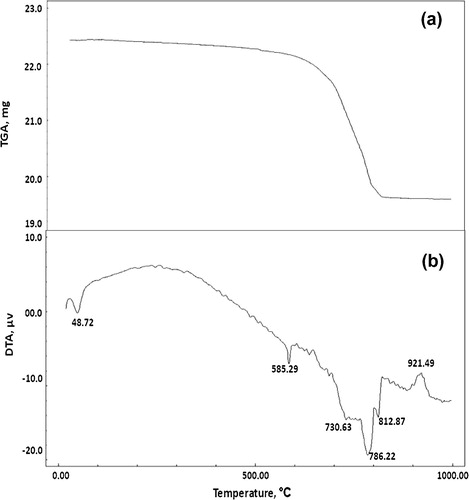
Fig. 3 Compressive strength of consolidated sand mixed with (1 OD) of bacterial cells and (1 M) equimolar of urea/calcium chloride, calcium acetate or calcium nitrate after four treatments.
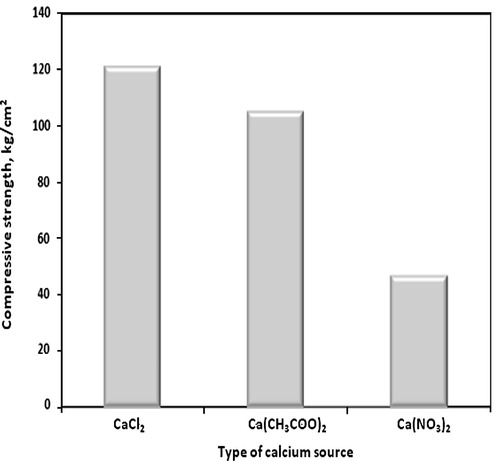
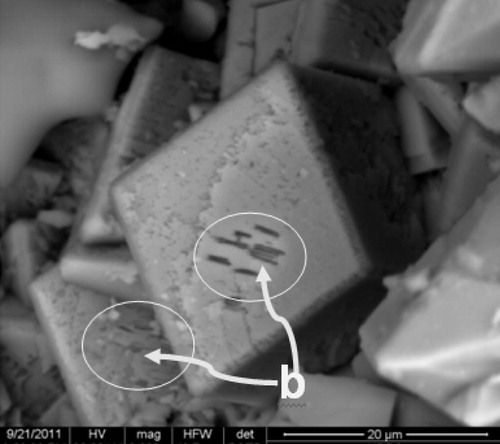
Fig. 8 SEM micrographs of consolidated sand by mixing with (1 OD) of bacterial cells and (1 M) of urea and (1 M) of different calcium sources; calcium chloride (a), calcium acetate (b) or calcium nitrate (c) at two different magnifications [(300 μm for a1, b1 and c1) and (50 μm for a2, b2 and c2)] after four treatments.
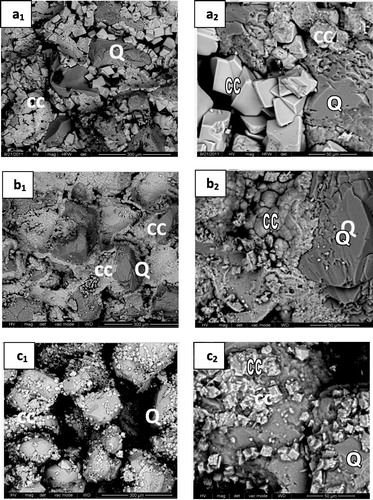
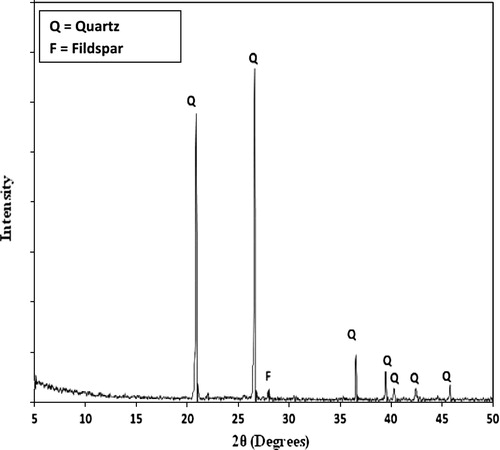
Fig. 4 XRD diffractograms of consolidated sand mixed with (1 OD) of bacterial cells and (1 M) equimolar of urea/calcium chloride calcium acetate or calcium nitrate and after four treatments.
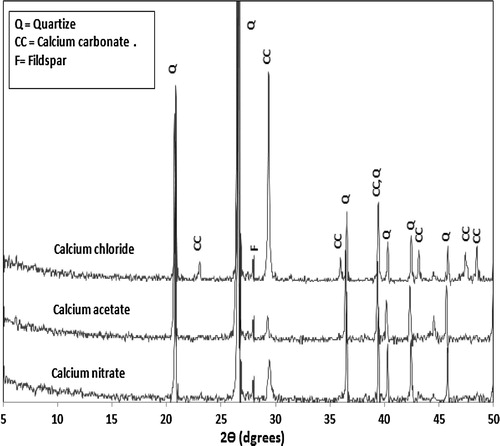
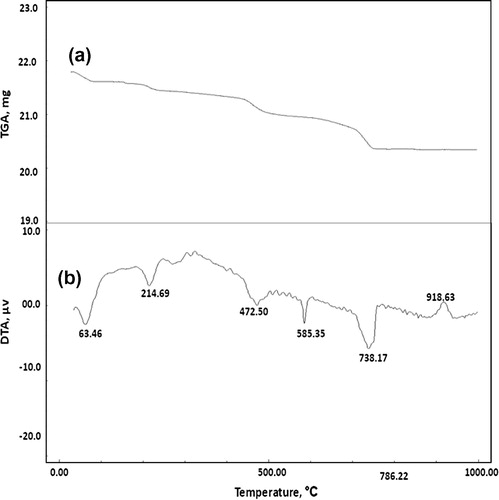
Fig. 6 TGA and DTA thermograms of consolidated sand mixed with (1 OD) of bacterial cells and (1 M) equimolar of urea/calcium acetate after four treatments.
