Figures & data
Fig. 4 COD removal efficiency along the whole experiment duration.
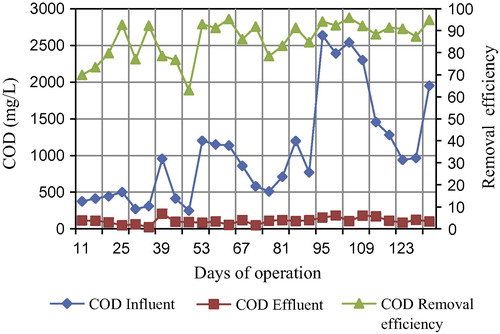
Fig. 1 The experimental setup.
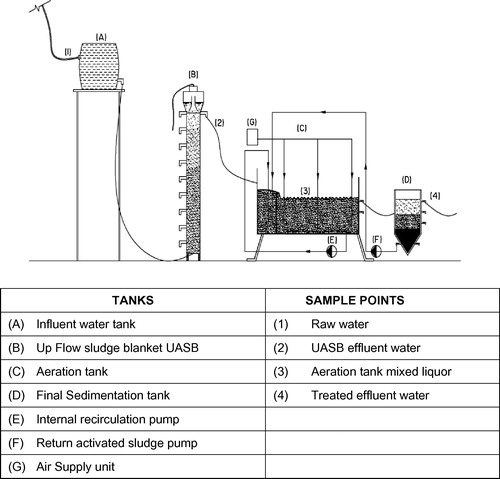
Table 2 Runs schedule.
Table 1 Tested operational parameters and the levels of testing.
Fig. 2 The organic loading rate along the experiment duration for the UASB and the activated sludge.
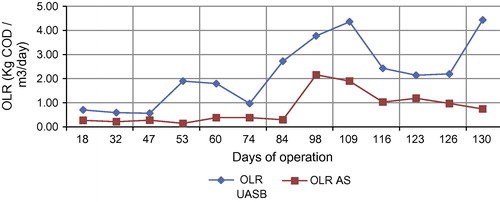
Table 3 Raw water characteristics during the Low organic loading runs.
Table 4 Low organic loading runs results.
Table 5 Raw water characteristics during the low organic loading runs.
Table 6 Medium organic loading runs results.
Table 7 Raw water characteristics during the low organic loading runs.
Table 8 High organic loading runs results.
Fig. 3 UASB TSS removal efficiency.
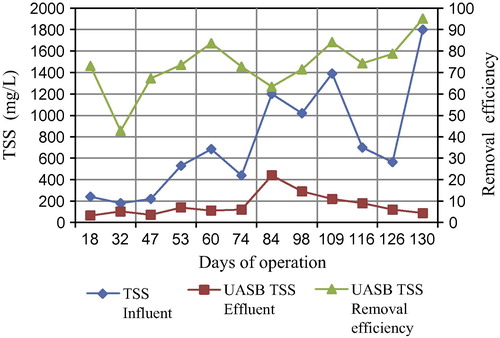
Fig. 5 TN removal efficiency along the experiment duration.
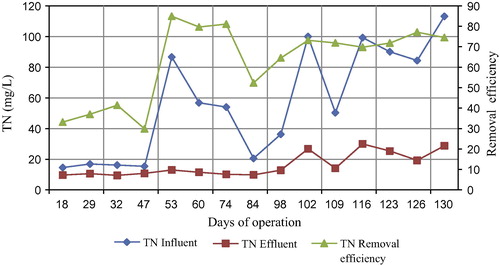
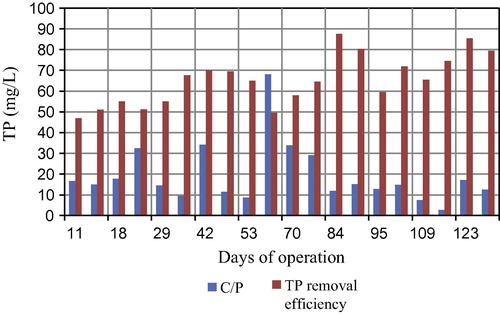
Fig. 6 TP removal along the experiment duration.
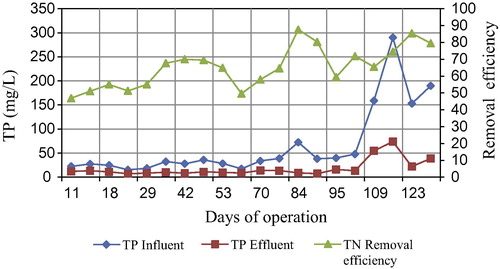
Fig. 7 The variation of phosphorus concentration with C/P feeding ratio in the process.