Figures & data
Figure 1 Budget allocation model development methodology.
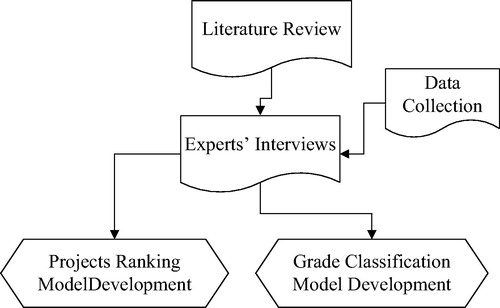
Table 1 Grade classification factors.
Table 2 Experts’ feedback.
Table 3 Factors’ relative weights calculations.
Table 4 Global weights of grade classification’s factor.
Table 5 Factors grade scales (scores).
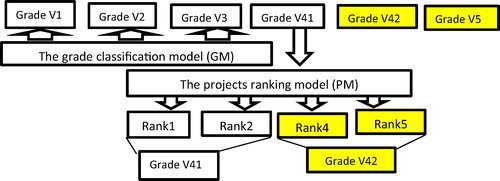
Figure 2 Sketch map for ranking projects and budget allocation of water mains rehabilitation projects.