Figures & data
Fig. 1 Concrete dimensions of tested beam.
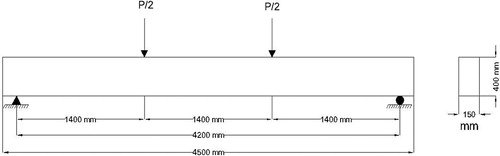
Fig. 2 Reinforcement detail of partially prestressed concrete beams with stirrups distribution along beam length.
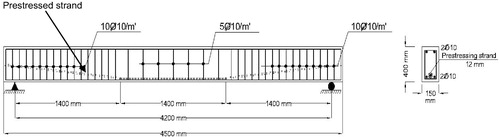
Fig. 3 Prestressed duct profile for 25 mm concrete cover.
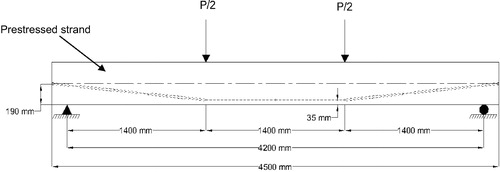
Table 1 Experimental program.
Table 2 Jacking force, initial prestressed force and extension value for theoretical and experimental result for all tested specimens.
Table 3 Mix design proportions.
Fig. 4 The drainage system that keeps the media wet for transporting the electrical field in the samples.
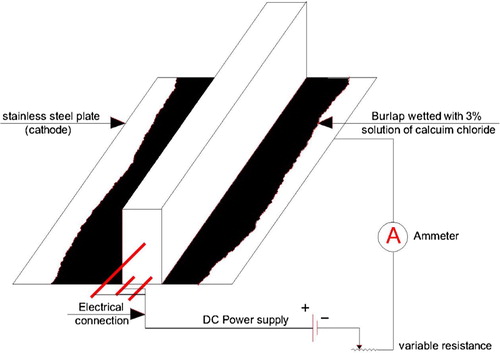
Fig. 5 Test setup for tested beams.
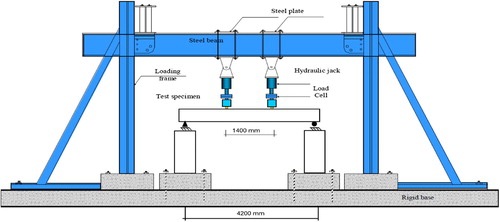
Fig. 6 Location of different instrumentations for tested beams.
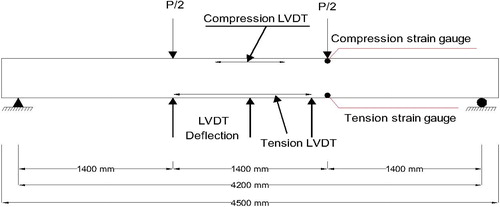
Table 4 Results of cracking, yielding, ultimate load capacities and the corresponding deflections of tested specimens.
Table 5 Results of ductility, initial stiffness and post cracking stiffness of tested specimens.
Table 6 The estimated minimum cross sectional area.
Fig. 7 Irregular corroded bars diameter for specimen B2. (a) Irregular corroded 1st bar diameter. (b) Irregular corroded 2nd bar diameter.
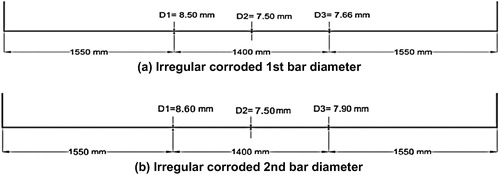
Fig. 8 Irregular corroded bars diameter for specimen B3. (a) Irregular corroded 1st bar diameter. (b) Irregular corroded 2nd bar diameter.
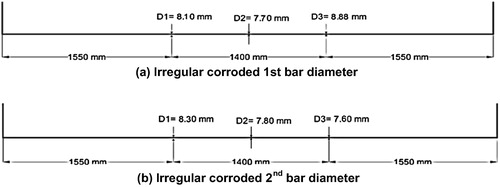
Fig. 9 Irregular corroded bars diameter for specimen B5. (a) Irregular corroded 1st bar diameter. (b) Irregular corroded 2nd bar diameter.
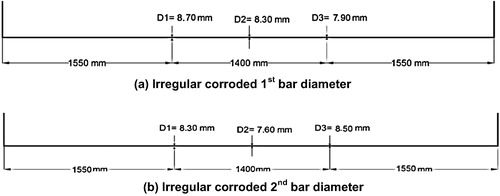
Fig. 10 Irregular corroded bars diameter for specimen B6. (a) Irregular corroded 1st bar diameter. (b) Irregular corroded 2nd bar diameter.
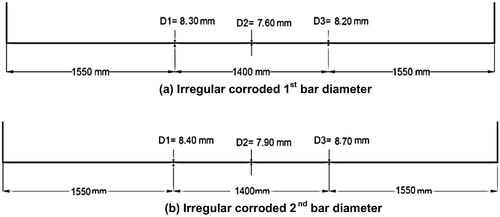
Table 7 Effect of percentage of steel reinforcement on partially prestressed beams capacities.
Fig. 11 Mapping of stress crack corrosion for specimens (B2, B3, B5, and B6).
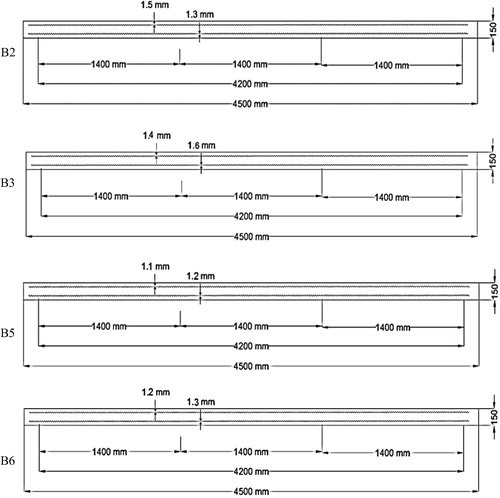
Fig. 12 Crack pattern and failure for specimens.
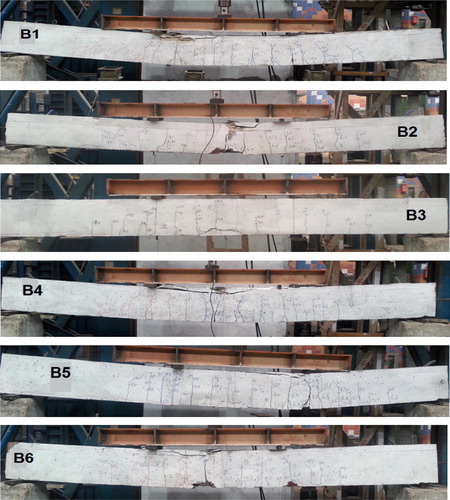
Fig. 13 The deterioration of the concrete against corroded rebar for samples.
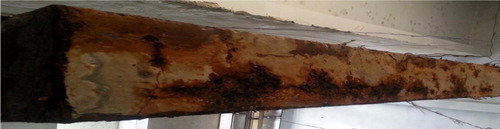
Fig. 14 Hair crack at anchorage zone.
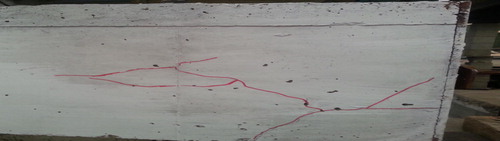
Fig. 15 Load-mid span deflection relationship for B1, B2, and B3.
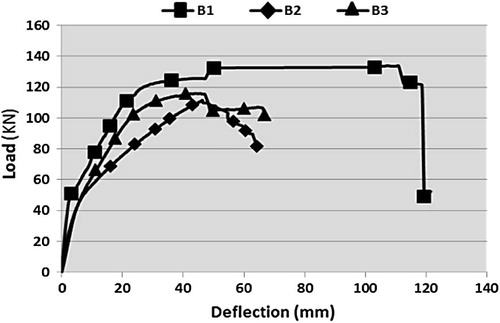
Fig. 16 Ductility of partially prestressed beams with 40 MPa compressive strength.
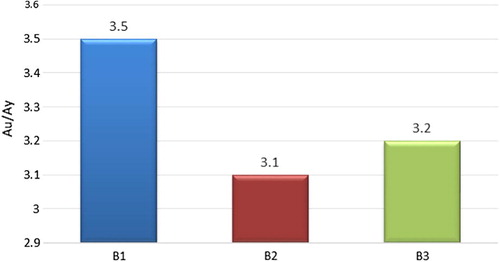
Fig. 17 Load-mid span deflection relationship for B4, B5, and B6.
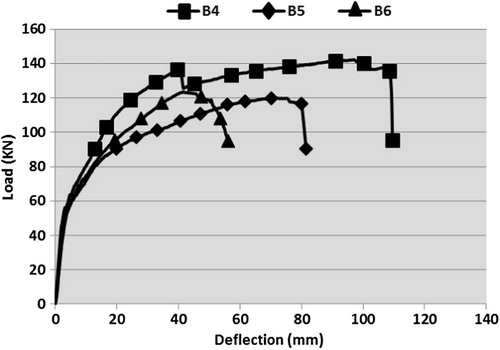
Fig. 18 Ductility of partially prestressed beams with 80 MPa compressive strength.
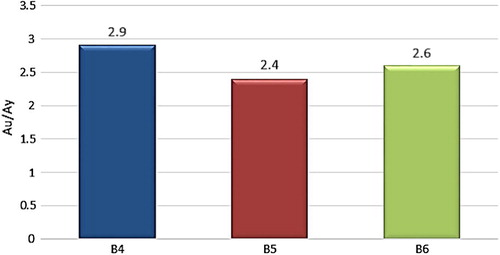
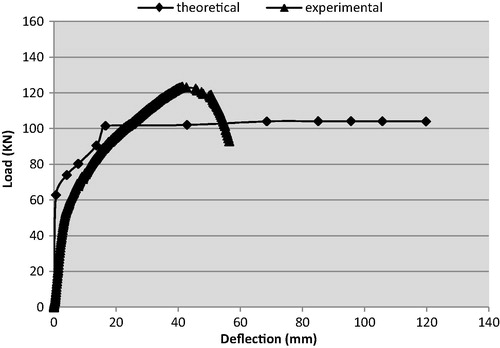
Fig. 19 Theoretical and experimental result of load–deflection curve for sample B1.
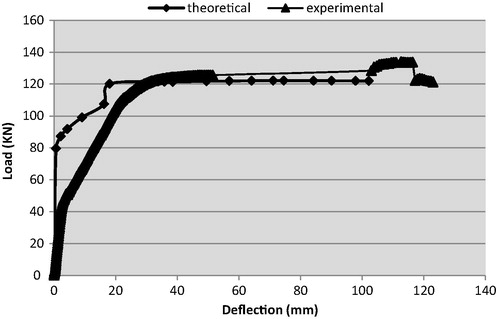
Fig. 20 Theoretical and experimental result of load–deflection curve for sample B2.
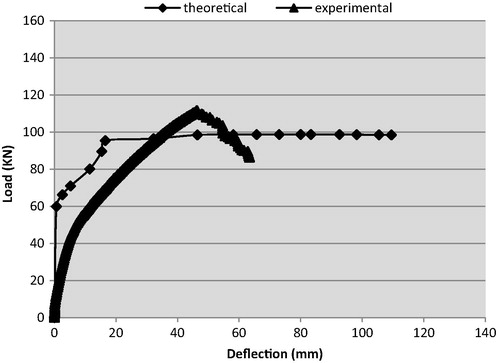
Fig. 21 Theoretical and experimental result of load–deflection curve for sample B3.
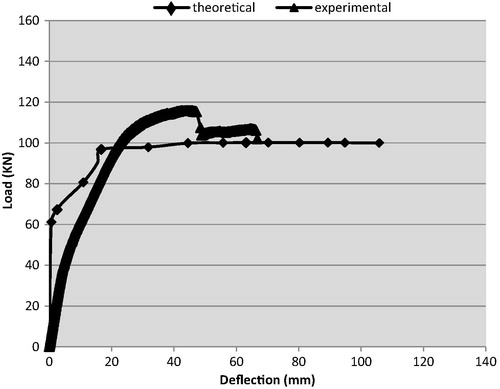
Fig. 22 Theoretical and experimental result of load–deflection curve for sample B4.
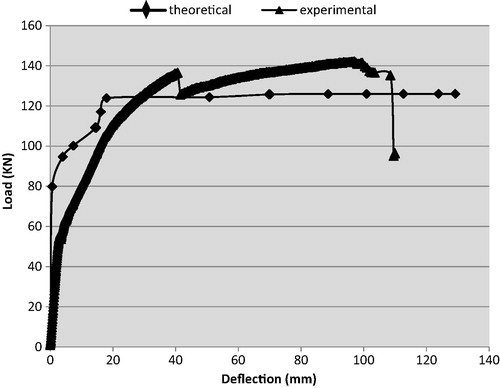
Fig. 23 Theoretical and experimental result of load–deflection curve for sample B5.
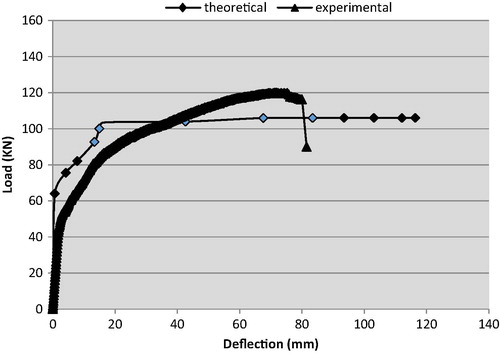
Fig. 24 Theoretical and experimental result of load–deflection curve for sample B6.