Ontogenic development of immunoglobulins (Igs)-positive lymphocytes in the lymphoid organs of native chickens of BangladeshFootnote
Peer review under responsibility of Faculty of Veterinary Medicine, Cairo University.
Md. Nabiul IslamDepartment of Anatomy and Histology, Faculty of Veterinary Science, Bangladesh Agricultural University, Mymensingh, 2202, Bangladesh;Division of Neuroanatomy, Graduate School of Medicine, Yamaguchi University, Ube, Yamaguchi, 755-8505, Japan
,
Mohammed Zahirul Islam KhanDepartment of Anatomy and Histology, Faculty of Veterinary Science, Bangladesh Agricultural University, Mymensingh, 2202, Bangladesh;Faculty of Veterinary Medicine, University Malaysia Kelantan, Locked Bag 36, Pengkalan Chepa, 16100 Kota Bharu, Kelantan, MalaysiaCorrespondence[email protected]
,
Mir Rubayet JahanDepartment of Anatomy and Histology, Faculty of Veterinary Science, Bangladesh Agricultural University, Mymensingh, 2202, Bangladesh;Division of Neuroanatomy, Graduate School of Medicine, Yamaguchi University, Ube, Yamaguchi, 755-8505, Japan
,
Ryutaro FujinagaDivision of Neuroanatomy, Graduate School of Medicine, Yamaguchi University, Ube, Yamaguchi, 755-8505, Japan
&
Koh ShinodaDivision of Neuroanatomy, Graduate School of Medicine, Yamaguchi University, Ube, Yamaguchi, 755-8505, Japan
Pages 96-101
|
Received 27 May 2013, Accepted 19 Sep 2013, Published online: 03 May 2019
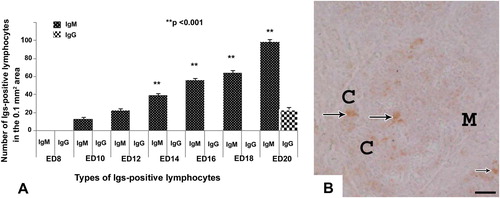
Figure 1 (A) The frequency of Igs-positive lymphocytes in the bursa of Fabricius from ED 8 to ED 20. The present graph shows that, IgM-positive lymphocytes are first detected in bursa of Fabricius on ED 10. The number of IgM-positive lymphocytes in bursa of Fabricius are increased significantly (p < 0.001) from the ED 14 to the ED 20 comparing with ED 10. IgG-positive lymphocytes are observed only on ED 20. No IgA-positive lymphocytes are present. Values are given in mean ± SEM (n = 6). (B) Immunostained sections of bursa of Fabricius of chicken’s embryo at ED 20. The IgM-positive lymphocytes (arrows) are present uniformly in cortex and medulla. C, cortex; M, medulla. Scale bar = 7.5 μm.
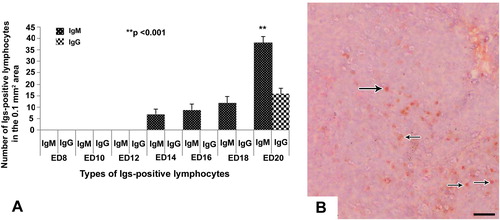
Figure 2 (A) The frequency of Igs-positive lymphocytes in the spleen from ED 8 to ED 20. The present graph shows that IgM-positive lymphocytes are first detected in spleen on ED 14. The number of IgM-positive lymphocytes in spleen are increased significantly (p < 0.001) on ED 20 comparing with ED 14. IgG-positive lymphocytes are observed only on ED 20. No IgA-positive lymphocyte is present. Values are given in mean ± SEM (n = 6). (B) Immunostained sections of the chicken’s embryonic spleen at ED 20. The IgM-positive cells (arrows) are present mainly around the white pulps. Scale bar = 7.5 μm.
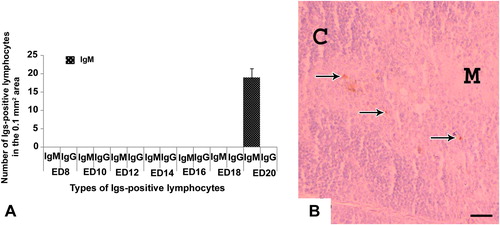
Figure 3 (A) The frequency of Igs-positive lymphocytes in the thymus from ED 8 to ED 20. The present graph shows that only IgM-positive lymphocytes are detected in spleen on ED 20. No IgG- and IgA-positive lymphocytes are observed. Values are given in mean ± SEM (n = 6). (B) Immunostained sections of thymus of chicken’s embryo at ED 20. The cortex of thymus shows more IgM-positive lymphocytes (arrows) than the medulla. C, cortex; M, medulla. Scale bar = 7.5 μm.
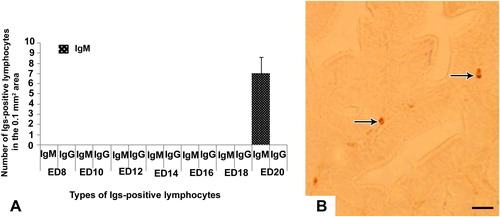
Figure 4 (A) The frequency of Igs-positive lymphocytes in the cecal tonsil from ED 8 to ED 20. The present graph shows that only IgM-positive lymphocytes are detected in cecal tonsil on ED 20. No IgG- and IgA-positive lymphocytes are observed. Values are given in mean ± SEM (n = 6). (B) Immunostained sections of the cecal tonsil of chicken’s embryo at ED 20. The lamina propria of cecal tonsils shows very few IgM-positive lymphocytes (arrows). Scale bar = 7.5 μm.
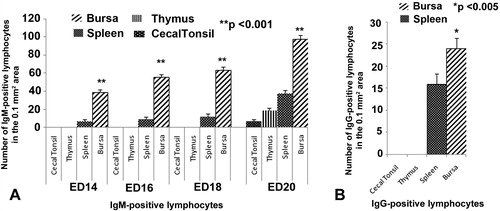
Figure 5 (A) The comparative frequency of IgM-positive lymphocytes in cecal tonsil, thymus, spleen and bursa of Fabricius from ED 14 to ED 20. The present graph shows the IgM-positive lymphocytes are significantly (p < 0.001) higher in bursa of Fabricius than that of other lymphoid organs at all stages from ED14 to ED20. Values are given in mean ± SEM (n = 6). (B) The comparative frequency of IgG-positive lymphocytes in cecal tonsil, thymus, spleen and bursa of Fabricius on ED 20. The present graph shows the IgG-positive lymphocytes are significantly (p < 0.005) higher in bursa of Fabricius than that of other lymphoid organs. Values are given in mean ± SEM (n = 6).