Figures & data
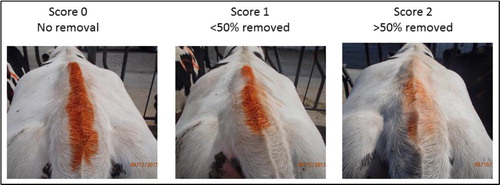
Table 1 Definitions of all behaviors observed in the study.
Table 2 Least squares means and associated standard errors of the mean (SEM) for the degree of tail paint removal (TPR) and behaviors related to the tail paint treatments for 18 dairy heifers.
Table 3 Incident ratio from Poisson regression for traits with treatment differences by comparison of tail paint treatments for 18 dairy heifers.
Table 4 Least squares means of initiated behaviors by comparison of expected low activity in wk 1 and high activity in wk 2.
Table 5 Least squares means of received behaviors and tail paint removed (TPR) by comparison of expected low activity in wk 1 and high activity in wk 2.
Table 6 Estimates of initiated behaviors by follicle size for 18 dairy heifers on day 7 and day 9 of 3 periods, as determined by ovarian ultrasound.
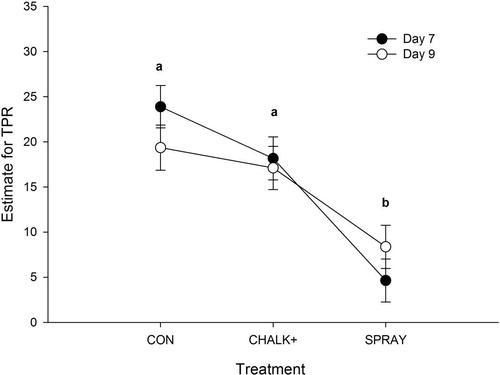
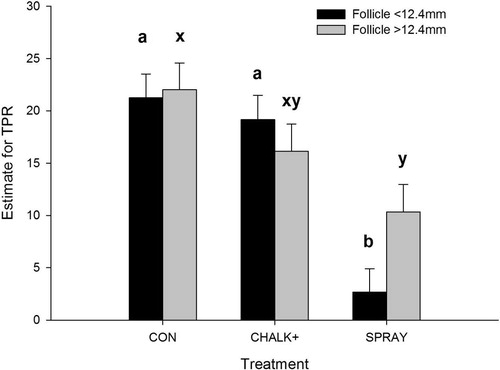
Table 7 Estimates of received behaviors and tail paint removed (TPR) by follicle size for 18 dairy heifers on day 7 and day 9 of 3 periods, as determined by ovarian ultrasound.