659
Views
17
CrossRef citations to date
0
Altmetric
Full Length Articles

Oxidative stress changes observed in selected organs of African giant rats (Cricetomys gambianus) exposed to sodium metavanadateFootnote

, , , &
Pages 80-89 | Received 24 Nov 2017, Accepted 14 Mar 2018, Published online: 03 May 2019

Figures & data

Fig. 1 Effect of sodium metavanadate on Malondialdehyde formation (A), Protein carbonyl (B), Hydrogen peroxide generation (C) and reduced glutathione (D) in the brain of exposed African giant rats at three different time points compared to controls. Asterisk (*) indicates significant difference (P < 0.05) while NS indicates no significant difference when treated groups were compared to the controls.

Table 1 Brain anti-oxidant enzyme profile, total thiol (PT) and non-protein thiol (NPT) following vanadium exposure to African giant rat at three different time points.

Fig. 2 Effect of Sodium metavanadate on Malondialdehyde formation (A), Protein carbonyl (B), Hydrogen peroxide generation(C), and reduced glutathione (D) in the kidney of exposed African giant rats at three different time points compared to controls. Asterisk (*) indicates significant difference (P < 0.05) while NS indicates no significant difference when treated groups were compared to the controls.

Table 2 Renal anti-oxidant enzyme profile, total thiol (PT) and non-protein thiol (NPT) following vanadium exposure to African giant rat at three different time points.

Fig. 3 Effect of Sodium metavanadate on Malondialdehyde formation (A), Protein carbonyl (B), Hydrogen peroxide generation(C), and reduced glutathione (D) in the testis of exposed African giant rats at three different time points compared to controls. Asterisk (*) indicates significant difference (P < 0.05) while NS indicates no significant difference when treated groups were compared to the controls.

Table 3 Testis anti-oxidant enzyme profile, total thiol (PT) and non-protein thiol (NPT) following vanadium exposure to African giant rat at three different time points.

Fig. 4 Effect of sodium metavanadate on Malondialdehyde formation (A), Protein carbonyl (B), Hydrogen peroxide generation (C) and reduced glutathione (D) in the liver of exposed African giant rats at three different time points compared to controls. Asterisk (*) indicates significant difference (P < 0.05) while NS indicates no significant difference when treated groups were compared to the controls.

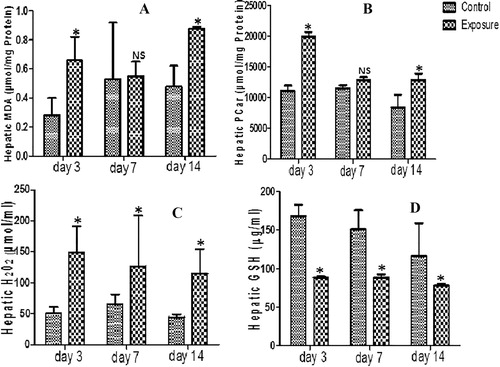
Table 4 Hepatic anti-oxidant enzyme profile, total thiol (PT) and non-protein thiol (NPT) following vanadium exposure to African giant rat at three different time points.

Fig. 5 Effect of sodium metavanadate on Malondialdehyde formation (A), Protein carbonyl (B), Hydrogen peroxide generation (C) and reduced glutathione (D) in the spleen of exposed African giant rats at three different time points compared to controls. Asterisk (*) indicates significant difference (P < 0.05) while NS indicates no significant difference when treated groups were compared to the controls.

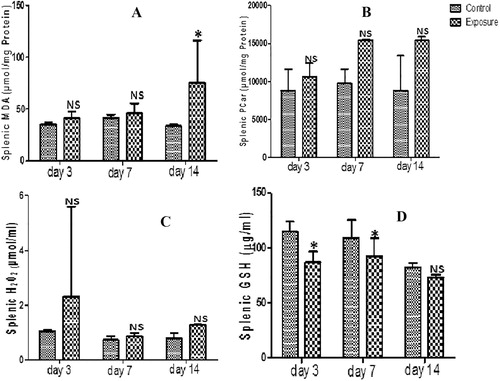
Table 5 Splenic anti-oxidant enzyme profile, total thiol (PT) and non-protein thiol (NPT) following vanadium exposure to African giant rat at three different time points.

Fig. 6 Effect of Sodium metavanadate on Malondialdehyde formation (A), Protein carbonyl (B), Hydrogen peroxide generation (C), and reduced glutathione (D) in the lungs of exposed African giant rats at three different time points compared to controls. Asterisk (*) indicates significant difference (P < 0.05) while NS indicates no significant difference when treated groups were compared to the controls.

Table 6 Lung anti-oxidant enzyme profile, total thiol (PT) and non-protein thiol (NPT) following vanadium exposure to African giant rat at three different time points.

Table 7 Serum markers of oxidative stress following vanadium exposure.