957
Views
14
CrossRef citations to date
0
Altmetric
Full Length Articles

Experimental ochratoxicosis A in Nile tilapia and its amelioration by some feed additivesFootnote

, , , &
Pages 149-158 | Received 19 Jul 2018, Accepted 17 Sep 2018, Published online: 03 May 2019

Figures & data

able 1 Outline of the experimental design.

able 2 Ingredients Proximate analysis of the experimental different dietary treatments.

ig. 1a Experimentally OTA intoxicated O. niloticus showing enlarged pale liver with necrotic foci, enlarged gall bladder, congested enlarged spleen and congested gills.
ig. 1b Experimentally OTA intoxicated O. niloticus showing enlarged pale liver, enlarged gall bladder, congested enlarged spleen, congested gills and kidneys.

able 3 Effect of different treatments on growth performance and survivability of Oreochromis niloticus at the end of the experiment.

able 4 Results of differential leukocyte count among different groups at the end of the experiment.

able 5 Results of serum total protein, albumin, globulin and albumin/globulin ratio among different groups at the end of the experiment.

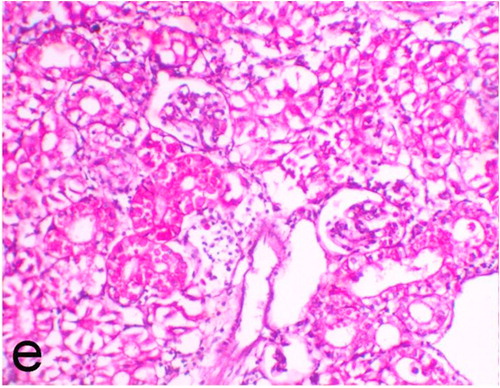
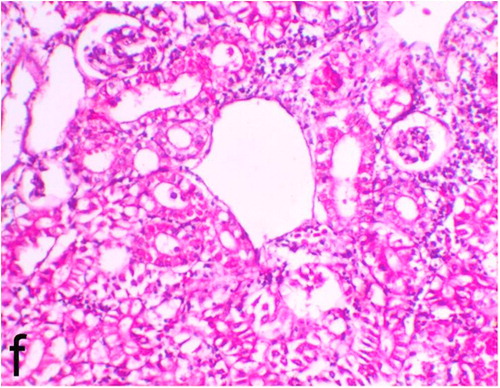
able 6 Effect of different treatments on serum AST, ALT, urea and creatinine of Oreochromis niloticus at the end of the experiment.

ig. 2a Negative control group, kidney showing normal histological structure. H&E. ×200.
ig. 2b Negative control group, liver showing normal lobular architecture with normal vacuolation of fat and glycogen. H&E. ×200.
ig. 3a Ochratoxin positive control group, kidney showing marked vacuolar degeneration of the renal tubular epithelium. H&E. ×200.
ig. 3b Ochratoxin positive control group, kidney showing focal interstitial mononuclear cell infiltrations predominantly macrophages and lymphocytes. H&E. ×200.
ig. 3c Ochratoxin positive control group, kidney showing wide dilatation of renal blood vessels. H&E. ×200.
ig. 3d Ochratoxin positive control group, kidney showing massive tubular necrosis. H&E. ×200.
ig. 3e Ochratoxin positive control group, kidney showing focal vacuolation and necrosis of the renal tubules and cystic tubular dilatation. H&E. ×200.
ig. 3f Ochratoxin positive control group, kidney showing cystic tubular dilatation, focal mononuclear cells infiltrations, increase of glomerular space and shrinkage of the glomerular tufts. H&E. ×200.
ig. 4a Ochratoxin positive control group, liver showing dilatation of hepatic blood vessels and vacuolation of the hepatocytes. H&E. ×200.
ig. 4b Ochratoxin positive control group, liver showing hydropic degeneration of the hepatocytes, rarefaction, increased eosinophilia of the cytoplasm and pyknosis of the nuclei. H&E. ×200.
ig.4c Ochratoxin positive control group, liver showing necrosis of the hepatocytes. H&E. ×200.
ig. 4d Ochratoxin positive control group, liver showing area of necrosis of the hepatocytes infiltrated with mononuclear cells. H&E. ×200.
ig. 5a Garlen Extra4 treated group (Group 3), kidney showing vacuolation of the renal tubular epithelium as well as mononuclear cell infiltrations. H&E. ×200.
ig. 5b Garlen Extra4 treated group (Group 3), liver showing hydropic degeneration of the hepatocytes. H&E. ×200.
ig. 6a Group 4 (Nigella sativa treated group), kidney showing marked vacuolation of renal tubular epithelium and dilatation of renal blood vessels. H&E. ×200.
ig. 6b Group 4 (Nigella sativa treated group), liver showing congestion and vacuolation of the hepatocytes. H&E. ×200.
ig. 7a Group 5 (Garlen Extra4 and Nigella sativa treated group), kidney showing mild vacuolation of the renal tubular epithelium. H&E. ×200.
ig. 7b Group 5 (Garlen Extra4 and Nigella sativa treated group), liver showing hydropic degeneration and congestion. H&E. ×200.
ig. 8a Group 6 (Fero Bind Pro treated group), kidney showing marked tubular vacuolation and focal necrosis of renal tubular epithelium. H&E. ×200.
ig. 8b Group 6 (Fero Bind Pro treated group), liver showing marked dilatation of hepatic blood vessels and vacuolation of the hepatocytes. H&E. ×200.