Figures & data
Fig. 1 Experimental procedure for preparation of 3D Cf/ZrC–SiC composites.
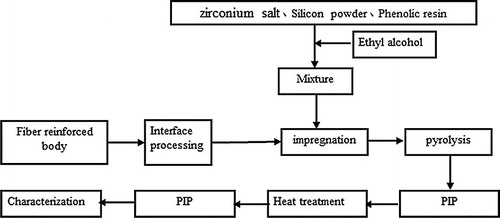
Fig. 2 The SEM images of zirconium carbonate before (a and b) and after (c and d) heat-treatment at 1500 °C for 60 min.
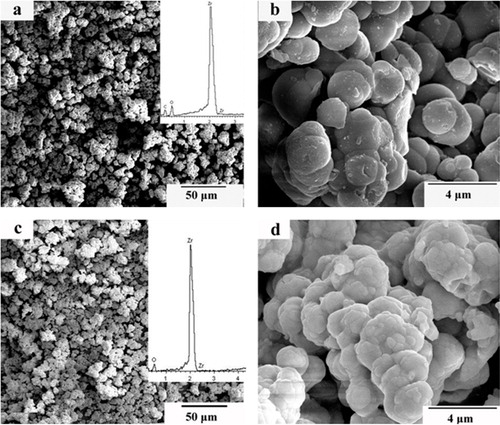
Fig. 3 DSC/TG analysis of zirconium carbonate from 0 °C to 1450 °C.
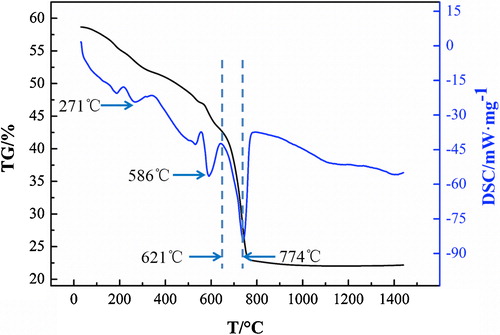
Fig. 4 The XRD patterns of the zirconium carbonate obtained by drying at 130 °C for 30 min (A), 1500 °C for 60 min (B) and after reaction with phenolic resin (C).
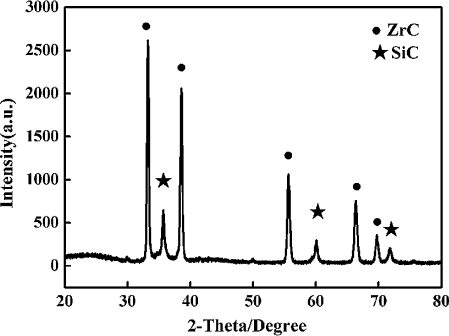
Fig. 5 The XRD pattern of the ZrC–SiC matrix with zirconium carbonate, thermosetting phenolic resin and Si powder as raw materials after heat treatment at 1500 °C for 60 min.
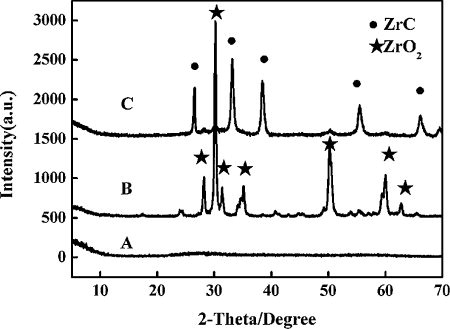
Fig. 6 The SEM images of the ZrC–SiC matrix heated at 1500 °C for 60 min: (a and b) using zirconium salt as raw material, and (c) using polycarbosilane and ZrC precursor as raw material.
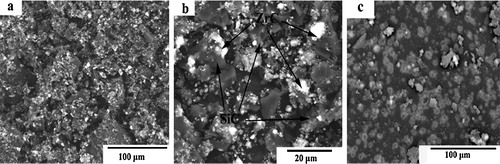
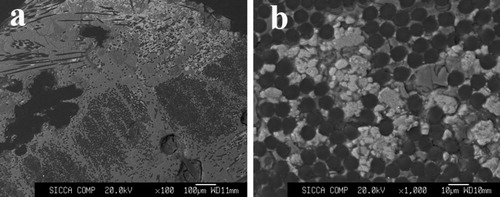
Fig. 7 SEM images on the polished cross-sections of 3D Cf/ZrC–SiC composite: (a) polished cross-sectional image and (b) larger magnification.