Figures & data
Fig. 1 Low-angle XRD patterns (A) and high-angle XRD patterns (B) of the samples obtained after crystallization at different temperatures for 36 h.
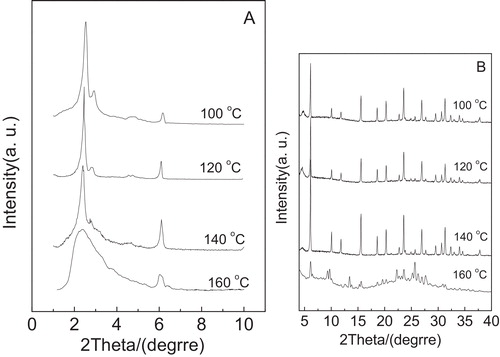
Fig. 2 Low-angle XRD patterns (A) and high-angle XRD patterns (B) of the samples obtained after crystallization at 120 °C for different times.
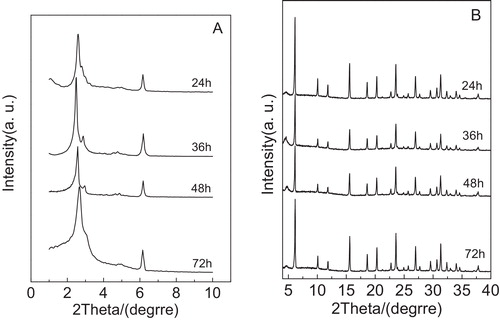
Table 1 Surface areas, average pore sizes, total pore volumes and XRD analysis of various samples.
Fig. 3 XRD patterns of samples obtained after hydrothermal treatment at 100 °C for different times. (A) Low-angle XRD patterns of Y/MCM-48; (B) high-angle XRD patterns of Y/MCM-48; (C) low-angle XRD patterns of MCM-48; (D) high-angle XRD patterns of NaY.
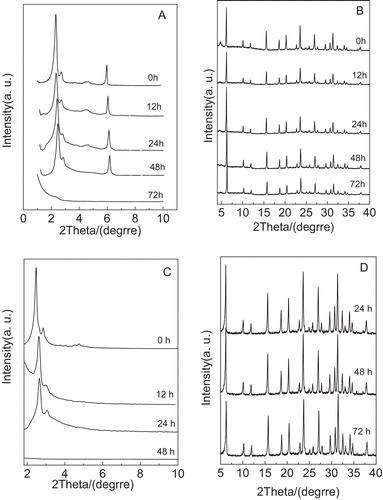
Fig. 4 XRD patterns of the samples obtained after thermal treatment at different temperatures for 4 h. (A) Low-angle XRD patterns of Y/MCM-48; (B) high-angle XRD patterns of Y/MCM-48; (C) low-angle XRD patterns of MCM-48; (D) high-angle XRD patterns of NaY.
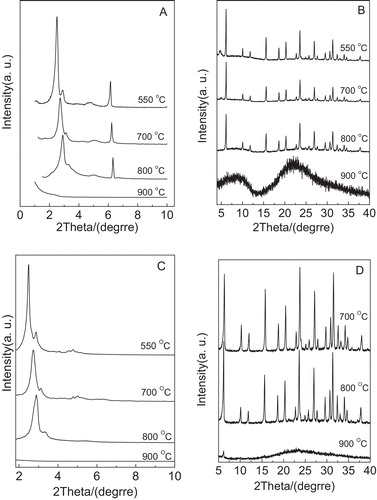
Fig. 5 Low-angle XRD patterns (A) and high-angle XRD patterns (B) of the samples obtained after treatment in 1 mol/L HCl solution for different times.
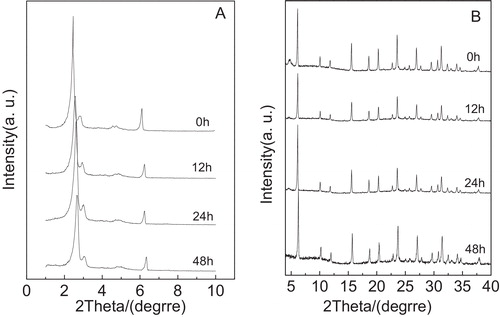
Fig. 6 Low-angle XRD patterns (A) and high-angle XRD patterns (B) of the samples obtained after treatment in 1 mol/L NaOH solution for different times.
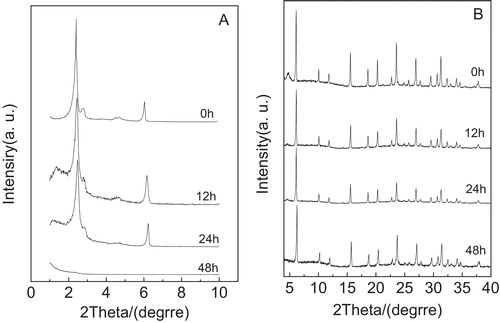
Fig. 7 N2 adsorption–desorption isotherms of the samples obtained after hydrothermal treatment at 100 °C for different times.
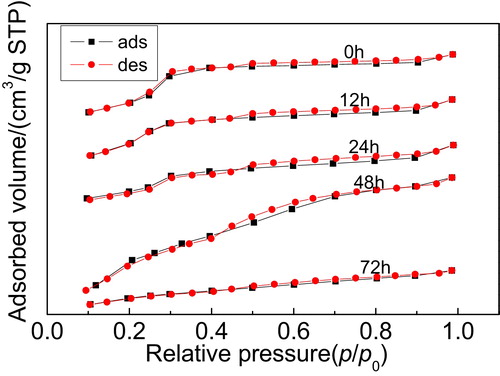
Fig. 8 N2 adsorption–desorption isotherms of the samples obtained after thermal treatment at different temperatures for 4 h.
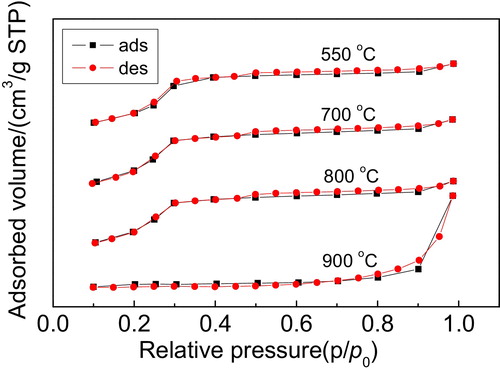
Fig. 9 N2 adsorption–desorption isotherms of the samples obtained after treatment in 1 mol/L HCl solution for different times.
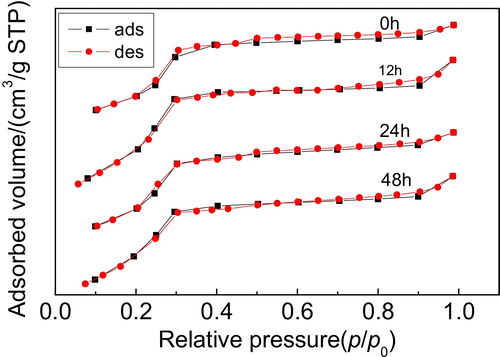
Fig. 10 N2 adsorption–desorption isotherms of the samples obtained after treatment in 1 mol/L NaOH solution for different times.
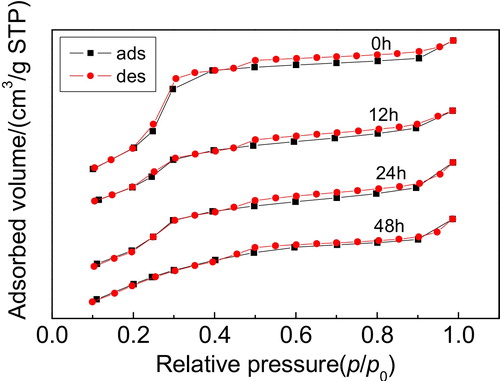
Fig. 11 SEM images of the samples: (A) NaY zeolite and (B) Y/MCM-48.
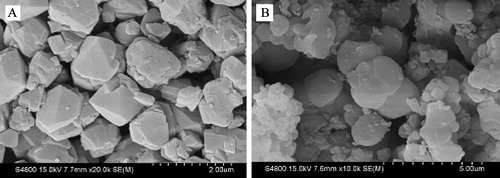
Fig. 12 TEM images of the samples. (A) TEM image of the sample after hydrothermal treatment for 48 h; (B) TEM image of the sample after thermal treatment at 800 °C for 4 h; (C) TEM image of the sample after treatment in 1 mol/L HCl solution for 48 h; (D) TEM image of the sample after treatment in 1 mol/L NaOH solution for 48 h.
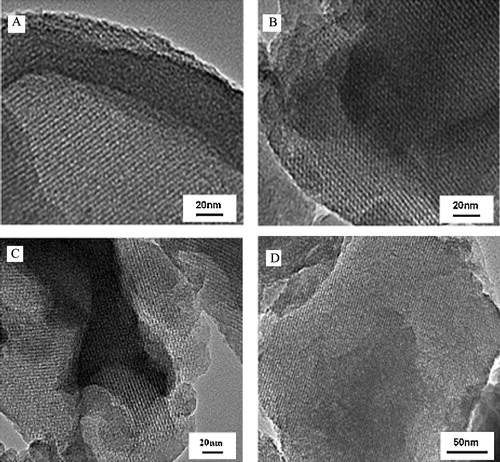
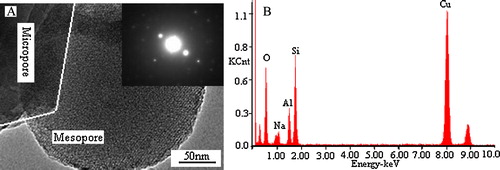
Fig. 13 TEM image of the Y/MCM-48 sample (A) and EDS spectrum of the microphase in the Y/MCM-48 sample (B). The inset in (A) is the SAED image of microphase.