Figures & data
Fig. 1 XRD patterns of as-prepared NiO–GDC(GNP) and NiO–GDC(GNP) powders calcined at 800–1100 °C for 2 h.
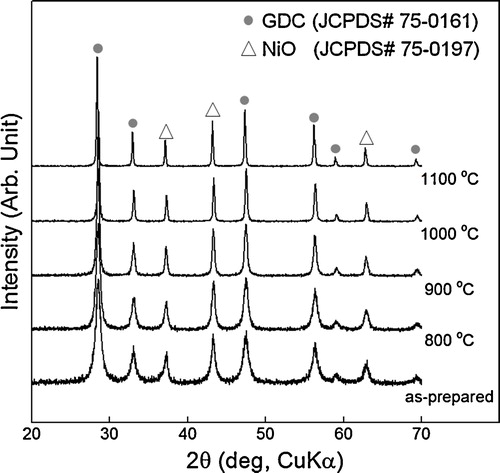
Fig. 2 Crystallite size of NiO–GDC(GNP) powders as a function of calcination temperature.
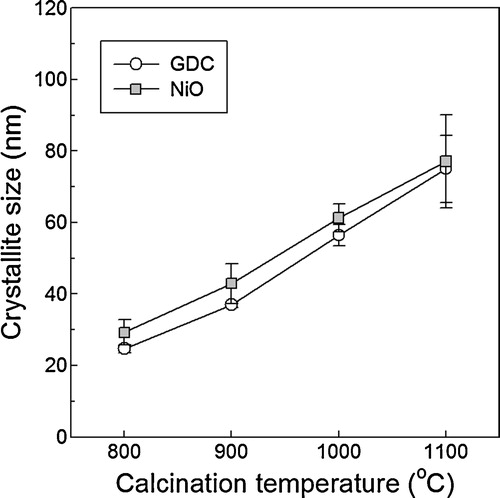
Fig. 3 Shrinkage behaviors of commercial GDC powders, NiO–YSZ support and NiO–GDC powders calcined at 900–1100 °C.
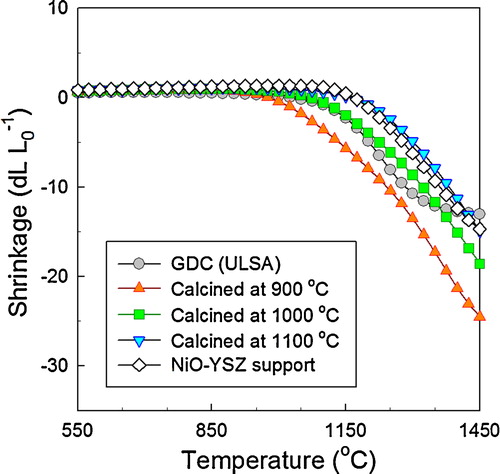
Fig. 4 TEM images of NiO–GDC powders calcined at 1000 °C: (a) TEM image, (b) EDS mapping, and (c and d) high-magnification images of GDC and NiO, respectively, taken from areas indicated in (a). (For interpretation of the references to color in this figure citation, the reader is referred to the web version of this article.)
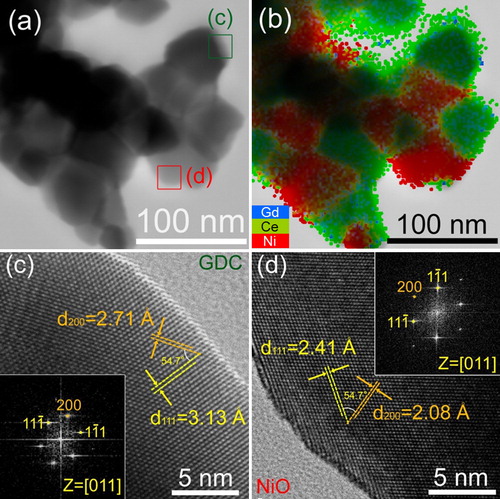
Fig. 5 SEM images of commercial (a) GDC, (b) NiO, (c) as-prepared NiO–GDC(GNP) powders, and (d) NiO–GDC(GNP) powders calcined at 1000 °C.
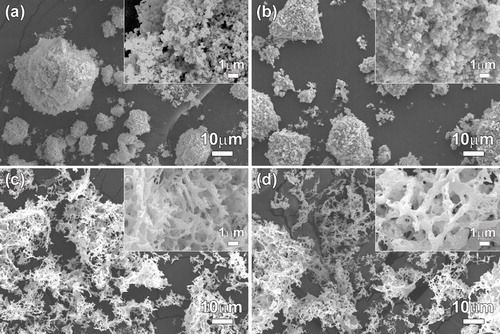
Fig. 6 Pore size distribution of Ni–GDC(BM) and Ni–GDC(GNP).
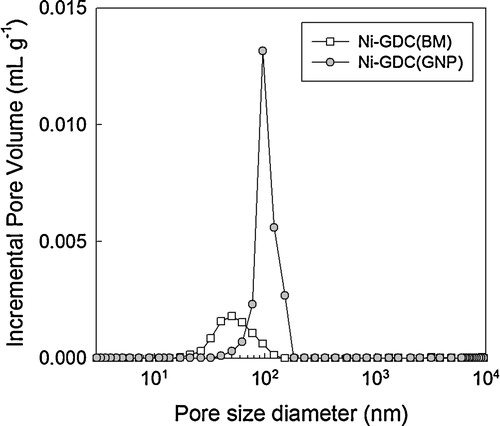
Fig. 7 Cross-sectional SEM images of the cell structures and Ni–GDC anode layers after measurement of cell characterization: (a and b) SOFC(BM) and (c and d) SOFC(GNP).
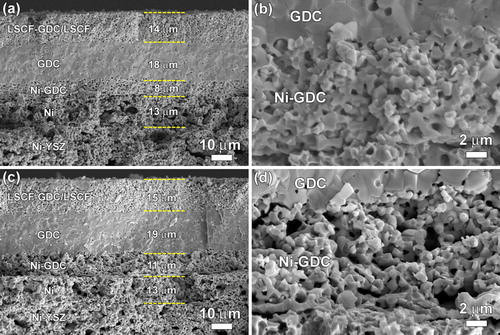
Fig. 8 Cross-sectional back-scattered electron images of GDC/Ni–GDC/Ni layer: (a) SOFC(BM) and (e) SOFC(GNP). EPMA elemental maps for (b) Ni, (c) Ce, and (d) Gd of SOFC(BM) and (f) Ni, (g) Ce, and (h) Gd of SOFC(GNP).
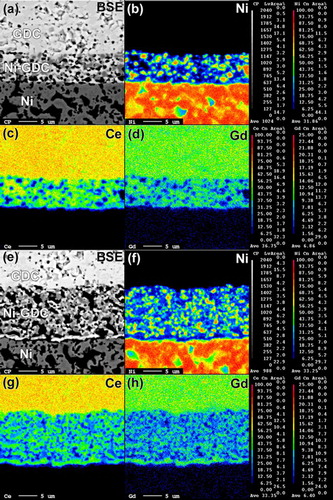
Fig. 9 Complex impedance spectra of (a) SOFC(BM) and (b) SOFC(GNP) at 450–600 °C.
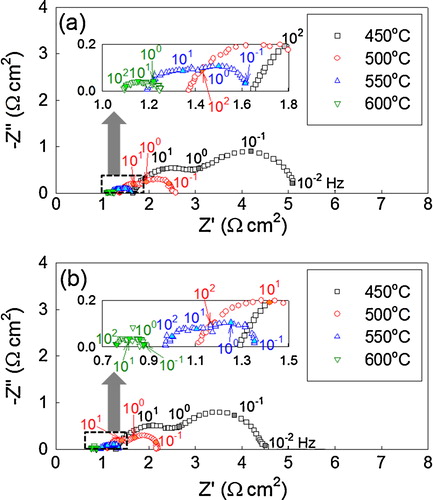
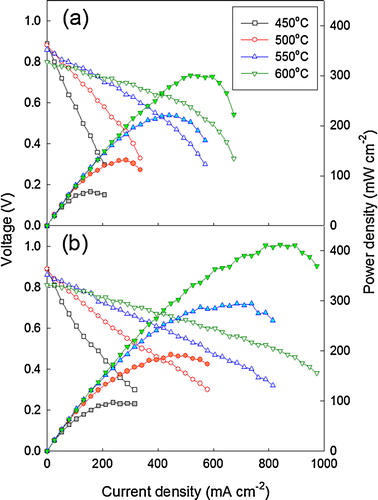
Fig. 10 I–V and I–P graphs of (a) SOFC(BM) and (b) SOFC(GNP) at 450–600 °C.