Figures & data
Fig. 1 Career exploitation of silica sand (Region of Mechraa Hammadi, Morocco-East).
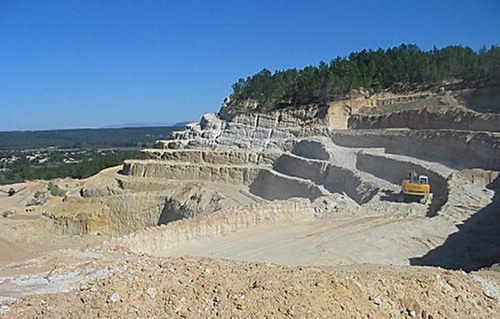
Table 1 Different granulometric fraction percent of pure alumina (PA).
Fig. 2 XRD patterns: (a) pure alumina (PA) and (b) recycled alumina (RA).
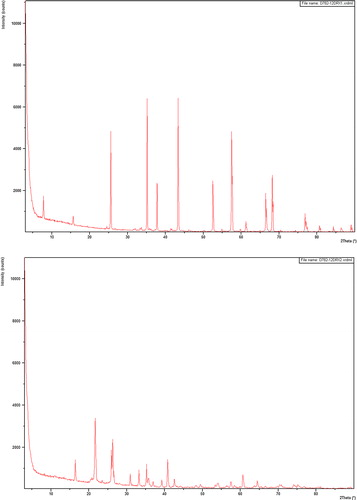
Fig. 3 Images of the two sources of alumina used in this study.
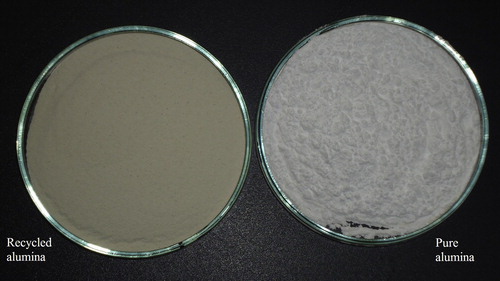
Table 2 Tested batch formulations (wt.%).
Fig. 4 Testing procedure for samples.
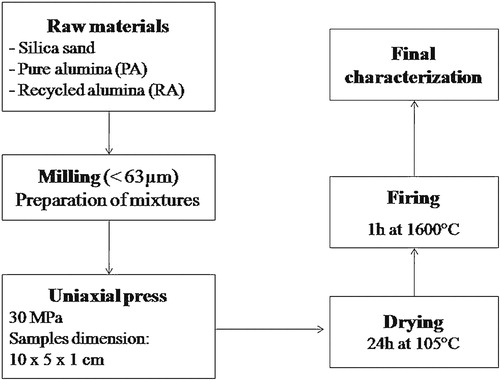
Table 3 Room temperature properties of M1 and M2 samples sintered at 1600 °C.
Fig. 5 Effect of firing temperature on bulk density (a) and apparent porosity (b).
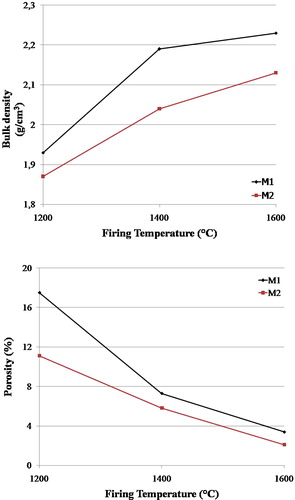
Fig. 6 Effect of temperature on flexural strength.
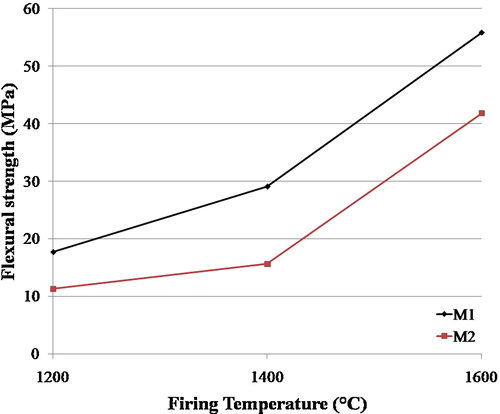
Fig. 7 Aspect of samples M1 and M2 fired at 1600 °C (other samples correspond to elaborate refractory from Moroccan geomaterials).
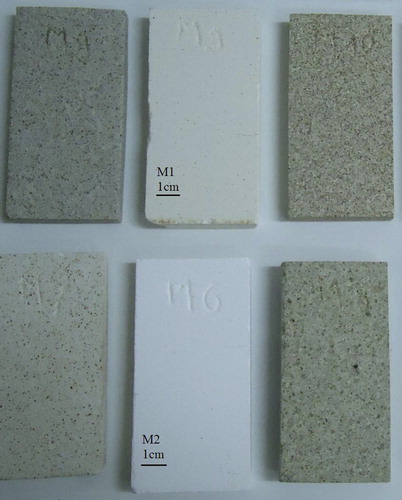
Fig. 8 Aspect of samples fired at 1600 °C and having undergone 200 cycles of thermal shock with a temperature difference of 925 °C (after mechanical test).
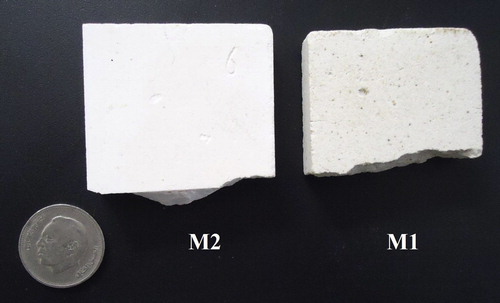
Fig. 9 Optical micrographs: (a) highly dense structure of the firebrick M2 (×57) and (b) less compacted structure of the firebrick M1 (×57).
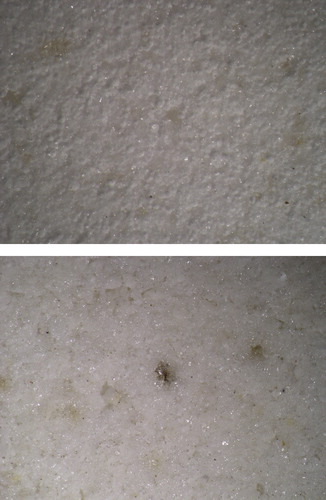
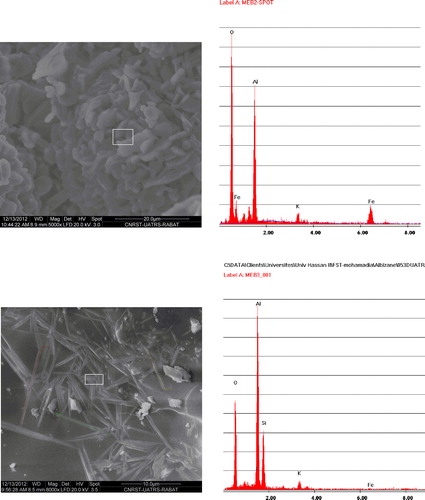
Fig. 10 SEM micrographs: (a) alumina in sample M2 and (b) EDX analysis of the square area in (a). (c) SEM micrographs of mullite in sample M1 and (d) EDX analysis of the square area in (c).