Figures & data
Fig. 1 XRD patterns of alumina synthesized at 150 °C for (A) 6 h, (B) 12 h and (C) 24 h, each calcined at (a) 500 °C, (b) 700 °C, (c) 900 °C, (d) 1000 °C and (e) 1100 °C. (▴): γ-Al2O3; (•): θ-Al2O3.
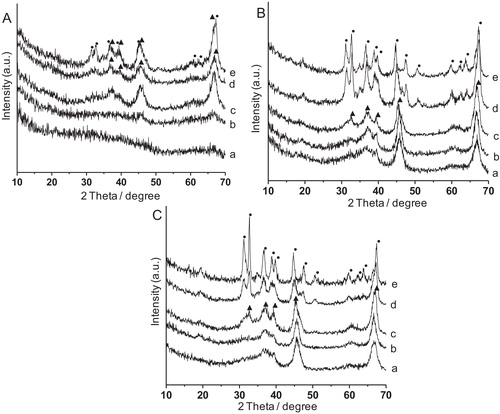
Fig. 2 FTIR spectra of the samples synthesized at 150 °C for (A) 6 h, (B) 12 h and (C) 24 h, each calcined at (a) 500 °C, (b) 700 °C, (c) 900 °C, (d) 1000 °C and (e) 1100 °C.
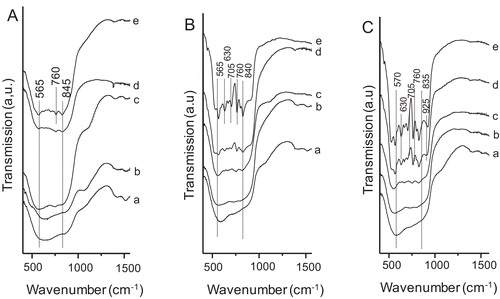
Table 1 Textural properties of alumina synthesized at 150 °C for 6 h, 12 h and 24 h, after calcination at 500, 700, 900 and 1000 °C each.
Fig. 3 Nitrogen adsorption–desorption isotherms and pore size distributions (PSD) (in the insets) of the samples synthesized at 150 °C for (a) 6 h, (b) 12 h and (c) 24 h, each calcined at 500, 700, 900, and 1000 °C.
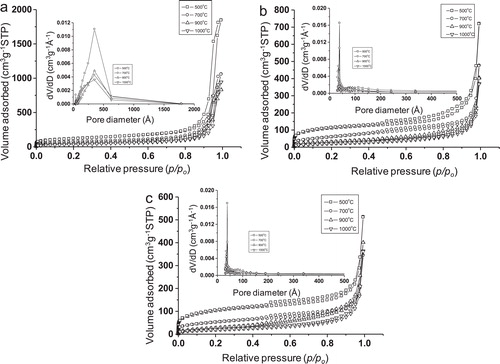
Fig. 4 Low-angle XRD patterns of alumina synthesized at 150 °C for 6 h, 12 h and 24 h, each calcined at 500 °C.
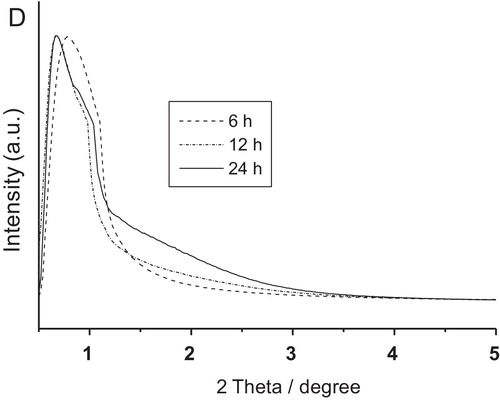
Fig. 5 FESEM images of alumina particles synthesized at 150 °C for (a) 6 h (b) 12 h and (e) 24 h, each calcined at 500 °C.
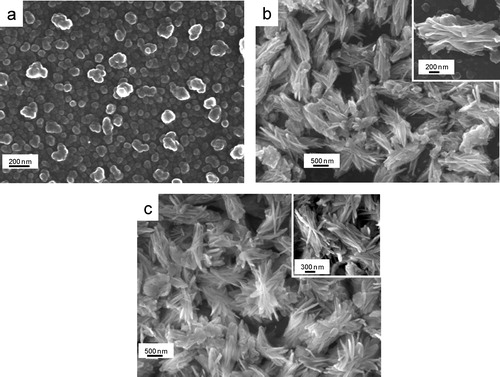
Fig. 6 FESEM images of alumina particles synthesized at 150 °C for (a) 6 h, (b) 12 h and (e) 24 h, each calcined at 1000 °C.
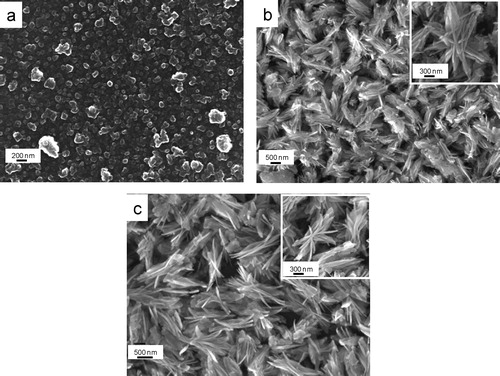
Fig. 7 TEM images of alumina particles synthesized at 150 °C for (a) 6 h, (b) 12 h and (c) 24 h, each calcined at 500 °C.
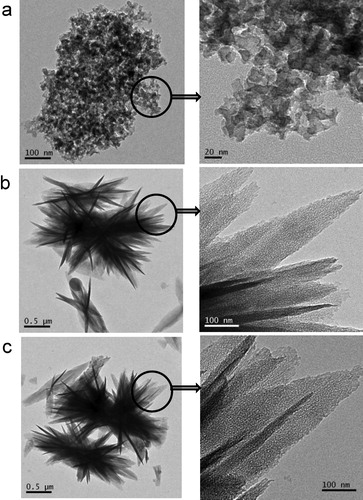
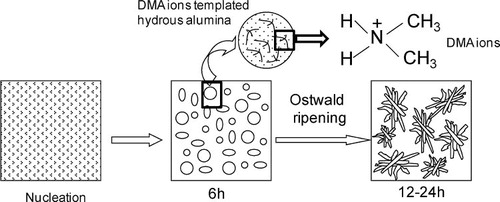
Fig. 8 Schematic representation for the formation of nanostructured mesoporous alumina.