Figures & data
Fig. 1 Standard Gibbs free energy of formation as a function of temperature for Al2O3, B2O3, TiO2 and NiO.
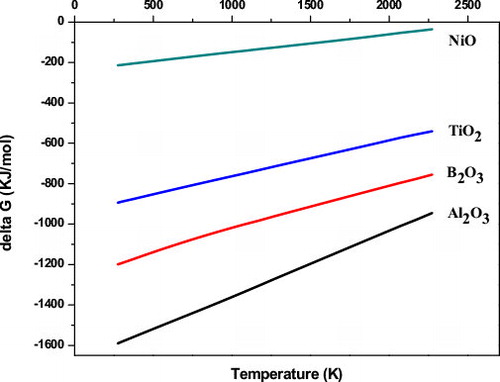
Table 1 Lattice parameter (a) of NiAl for different milling times.
Fig. 2 XRD patterns of the Ni-containing powders after different milling times. The inset picture shows corresponding local amplification.
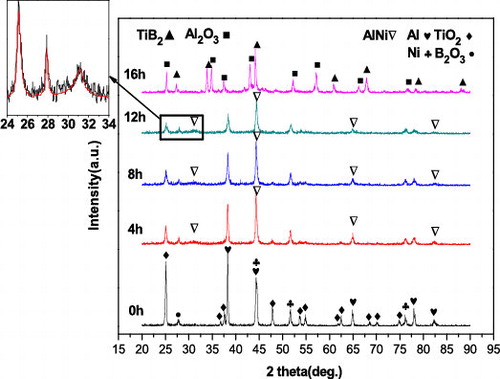
Fig. 3 XRD patterns of the Ni-free powders after different milling times.
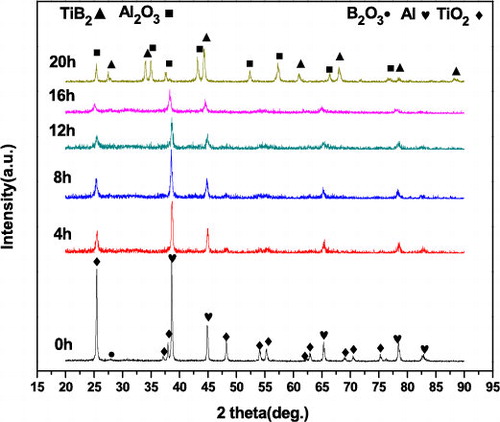
Fig. 4 The variation of crystallite size (a) and lattice strain (b) of Al in the two types of powders at different milling times.
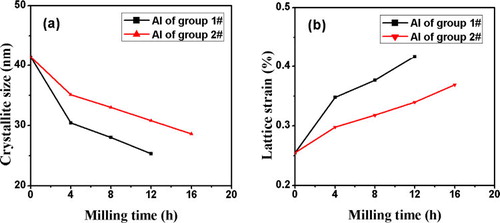
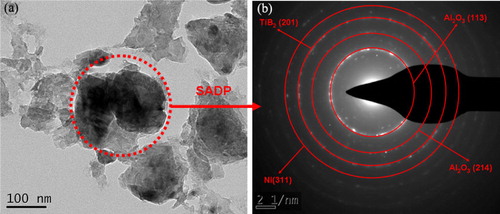
Fig. 5 TEM images (a) and associated SADPs (b) of the Group #1 powder milled for 16 h.