Figures & data
Table 1 Microstructure observation for fixing the working range of parameters.
Fig. 1 Experimental details.
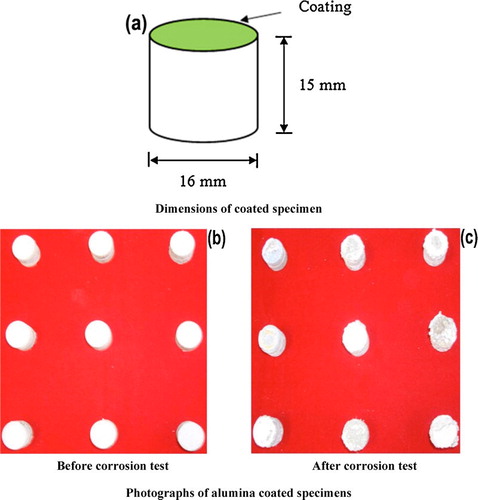
Table 2 Important APS process parameters and their levels.
Table 3 Design matrix and experimental results.
Fig. 2 Measure the porosity level using computer image analyzing software.
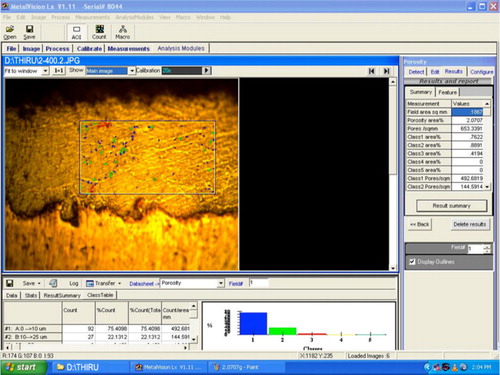
Table 4 Results summary of porosity analysis.
Fig. 3 (a) SEM image of alumina coating, (b and c) high magnification images of pore and crack and (d) cross-section of the alumina coated specimen after immersion in NaCl solution.
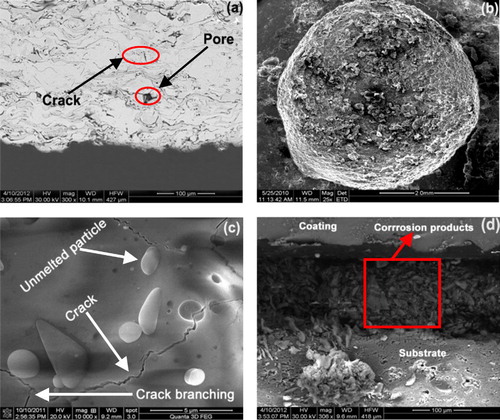
Fig. 4 Optical micrograph of the Al2O3 powder.
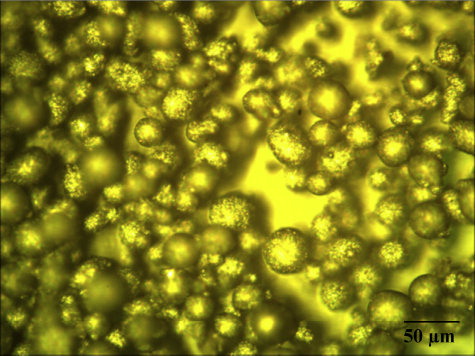
Fig. 5 SEM surface morphology of alumina coating.
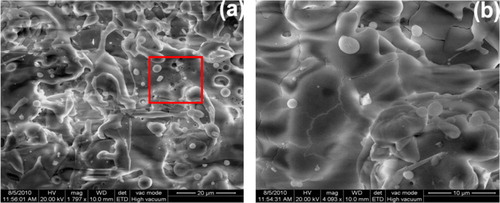
Fig. 6 Optical microstructure and SEM image of the coating.
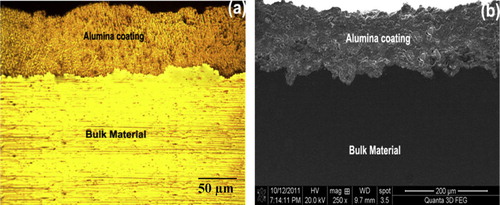
Fig. 7 EDAX analysis.
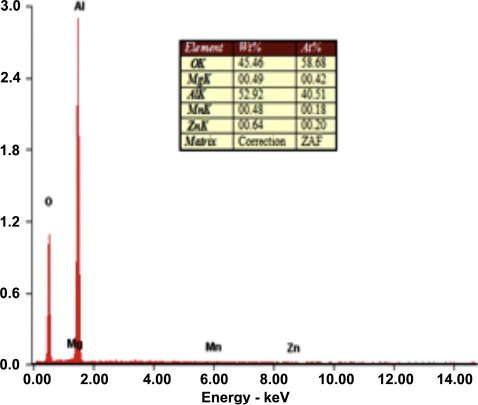
Table 5 ANOVA test results.
Fig. 8 Normal probability plot for the response.
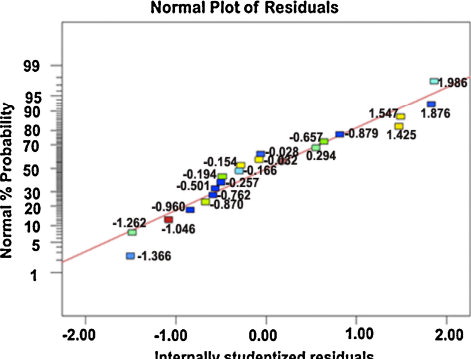
Fig. 9 Correlation plot for the response.
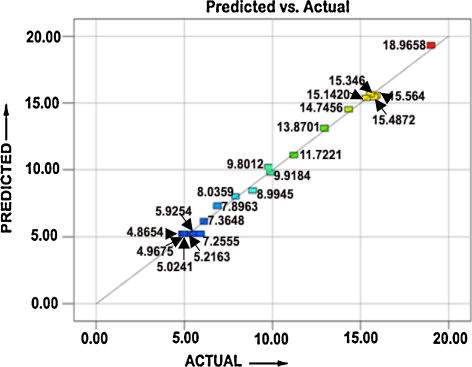
Fig. 10 Effect of power and stand-off distance on corrosion rate.
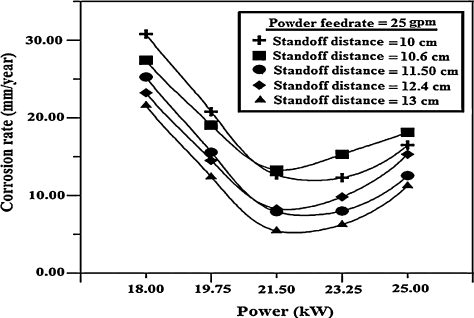
Fig. 11 Effect of powder feed rate and power on corrosion rate.
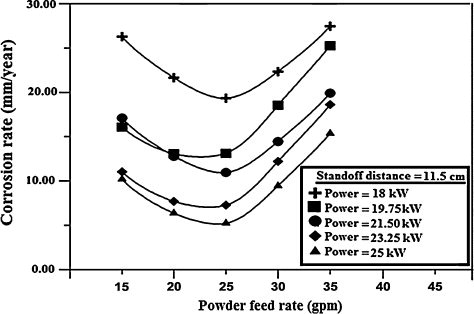
Fig. 12 Effect of APS process parameters on porosity level.
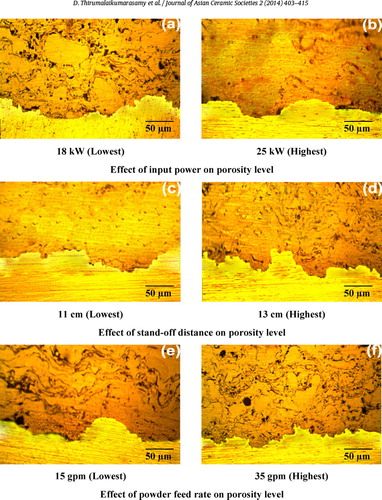
Fig. 13 Effect of APS process parameters on corrosion rate.
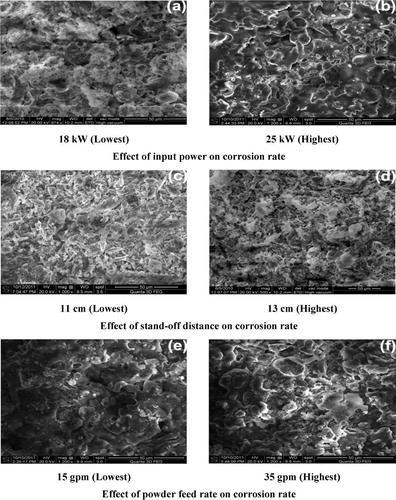
Fig. 14 (a) Cross section of as-sprayed alumina coating on AZ31B magnesium alloy after immersion in NaCl solution for 6 h (b and c) EDX and XRD pattern analysis.
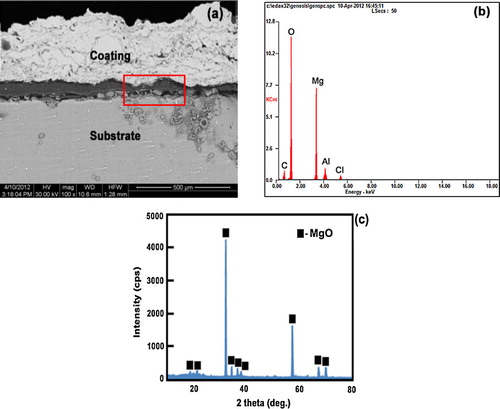
Fig. 15 SEM micrographs (a) and X-ray diffraction analysis (b) of the corroded surface after 6 h exposure of coatings.
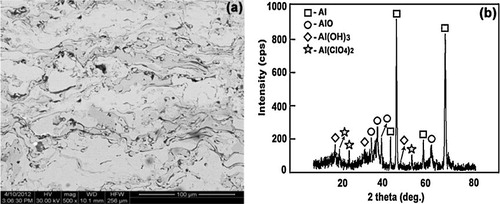
Fig. 16 (a) SEM micrograph showing corrosion product in the cross section of as-coated coating exposed for 6 h and (b) EDS analysis.
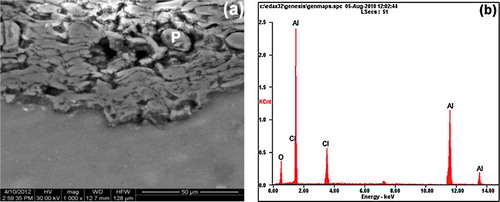
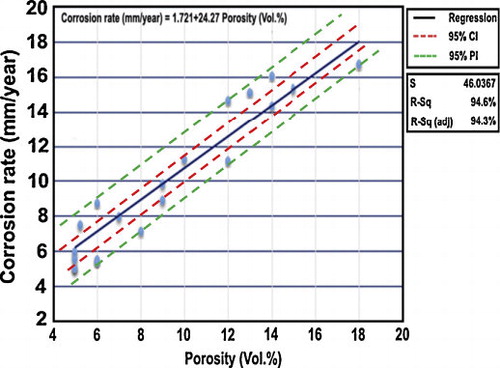
Fig. 17 Relationship graph for porosity and corrosion rate.