Figures & data
Fig. 1 XRD patterns of the products after the reaction of CuO with NaNH2at (a)120°C, (b) 150°C, (c) 170°C, and (d) 190°C for 60 h.
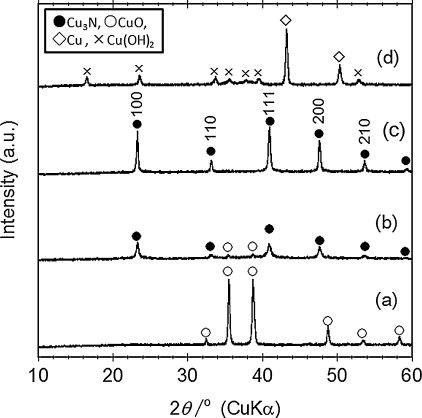
Fig. 2 SEM images of (a) CuO and (b) Cu3N synthesized at 170°C for 60 h. TypicalEDX spectra are shown.
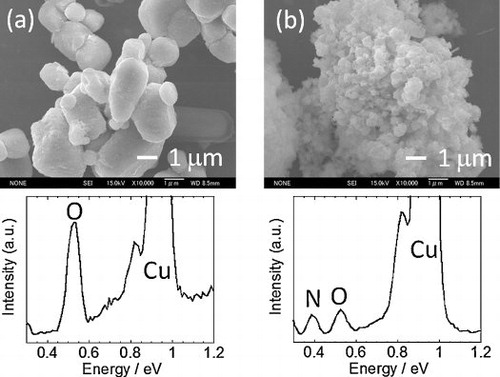
Fig. 3 XPS profiles of Cu3N powder synthesized at 170°C for 60 h.
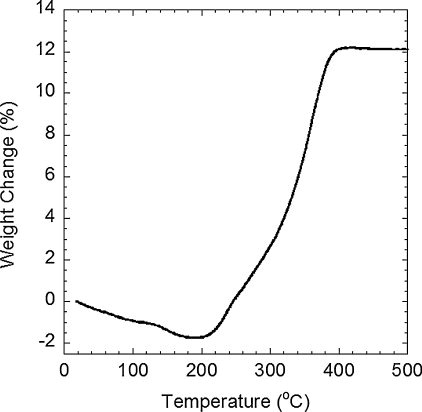
Fig. 4 Weight change upon thermal oxidation of Cu3N synthesized at 170°C for 60 h: airflow of 100 mL min-1, heating rate of 10 K min-1.
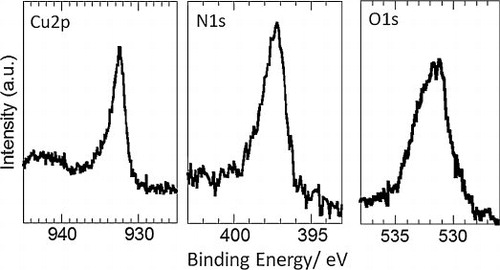
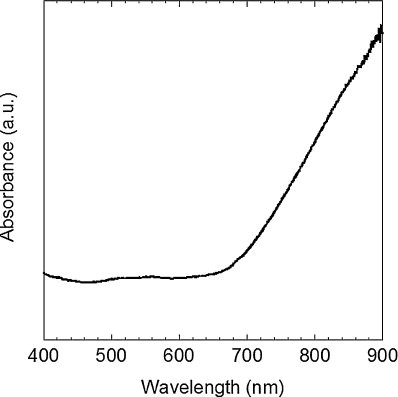
Fig. 5 UV.vis spectrum of Cu3N powder synthesized at 170°C for 60 h.