Figures & data
Fig. 1 (a) Relative density and the decrease of specific surface area and (b) compressive strength for the SiC hot-pressed at 1400–1900 °C.
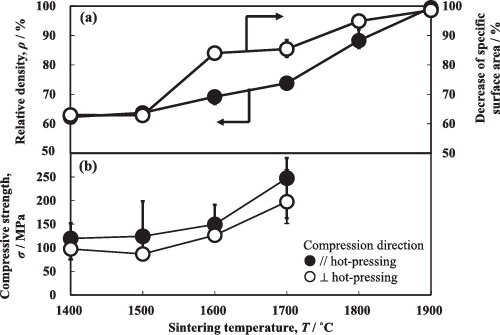
Fig. 2 Microstructures of SiC hot-pressed at 1400–1900 °C for 2 h.
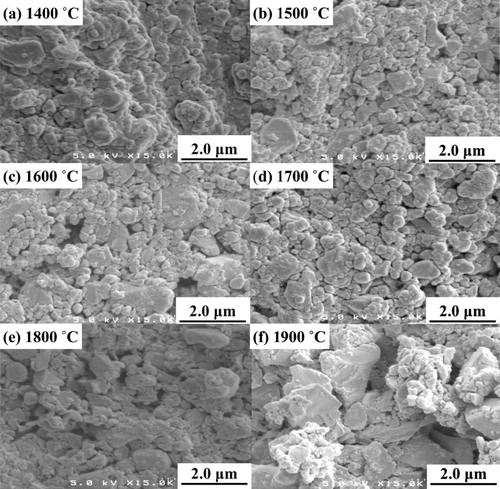
Fig. 3 Relationship between compressive stress and strain for SiC hot-pressed at 1400–1900 °C. The compression direction is (a) parallel and (b) perpendicular to the hot-pressing direction.
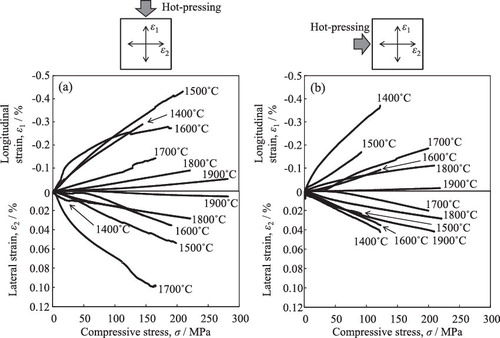
Fig. 4 Porosity dependence of strains at the compressive fracture of SiC. See for the definition of longitudinal and lateral strains.
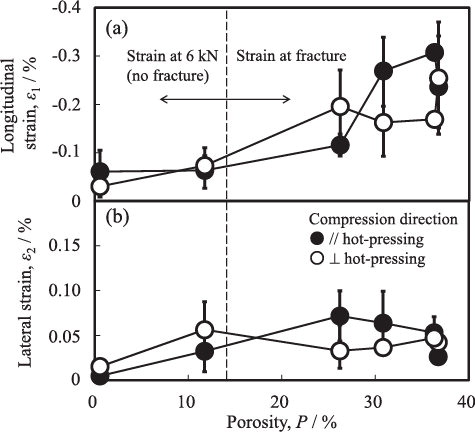
Fig. 5 Relationship between the Poisson's ratio and porosity of the SiC hot-pressed at 1400–1800 °C.
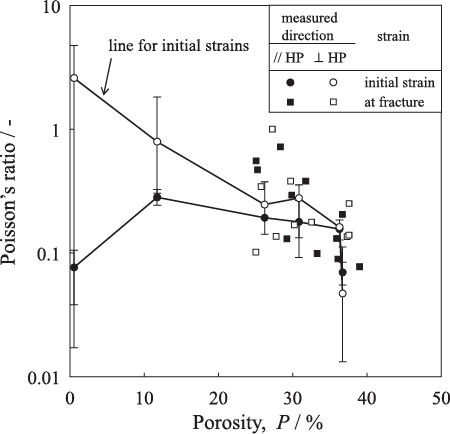
Fig. 6 Dependence of the Young's modulus on the decrease of specific surface area for the SiC hot-pressed at 1400–1900 °C.
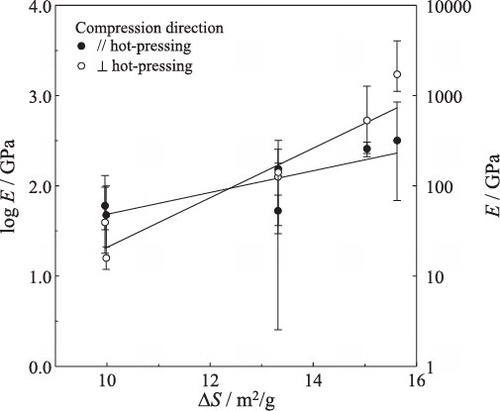
Fig. 7 Relationship between compressive strength and porosity of porous SiC compacts.
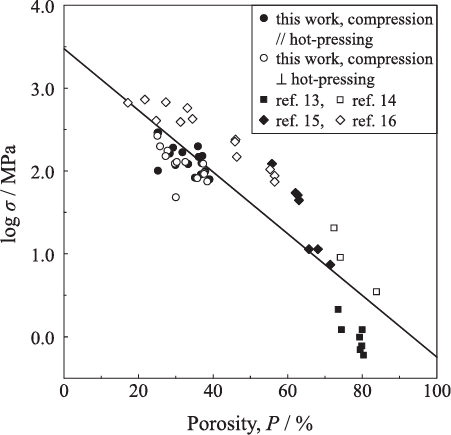
Fig. 8 Dependences of (a) compressive strength and (b) fracture energy on the decrease of specific surface area for the SiC hot-pressed at 1400–1700 °C.
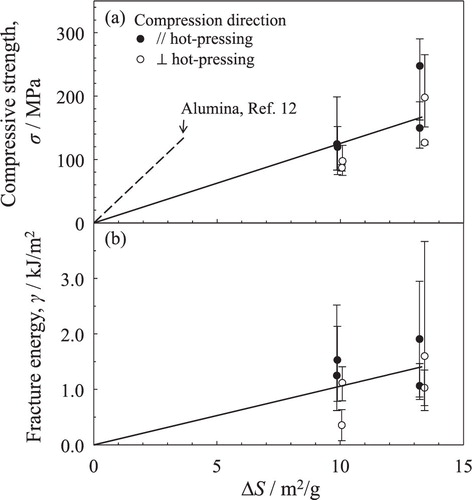
Fig. 9 Relative density–shrinkage relation during hot-pressing of SiC compacts and for model structures of (a) close packing structure (coordination number of particles n = 12), (b) body-centered structure (n = 8) and (c) simple cubic structure (n = 6).
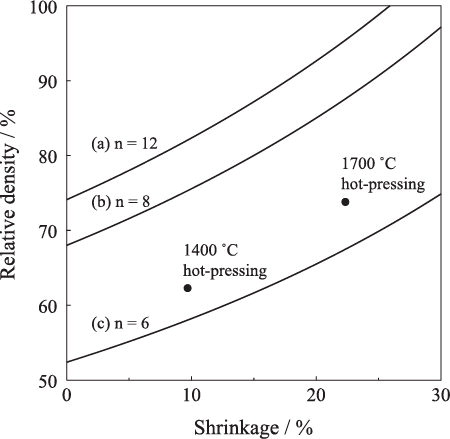
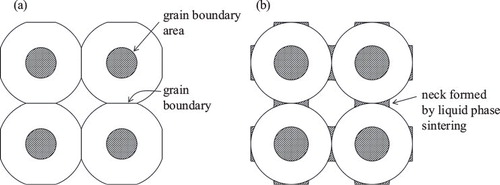
Fig. 10 Scheme showing (a) the grain boundary structure formed by solid state sintering (Al2O3 compact) and (b) the neck structure formed by liquid phase sintering (SiC compact).