Figures & data
Table 1 Chemical composition of the investigated glasses.
Table 2 Different thermal properties of the investigated glasses.
Fig. 1 DSC thermograms of the precursor glasses.
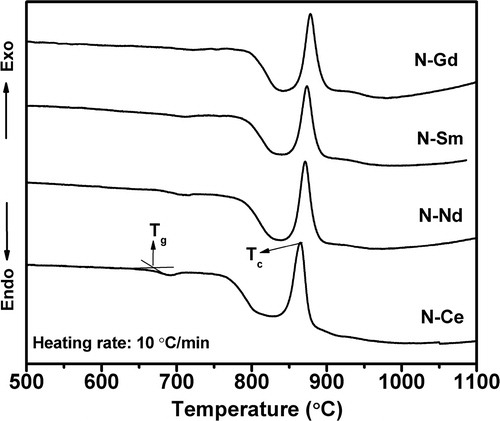
Fig. 2 Dilatometric thermograms of the precursor glasses.
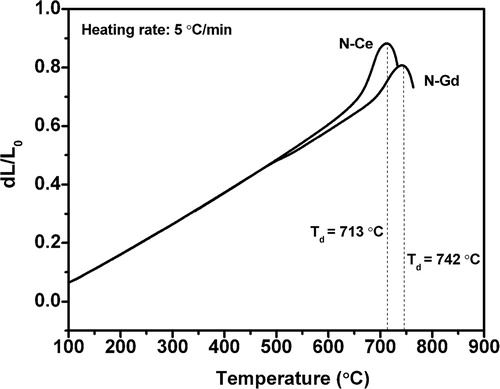
Fig. 3 Variation of Tg, Td and Tc as a function of ionic radius of the rare earths added in glass.
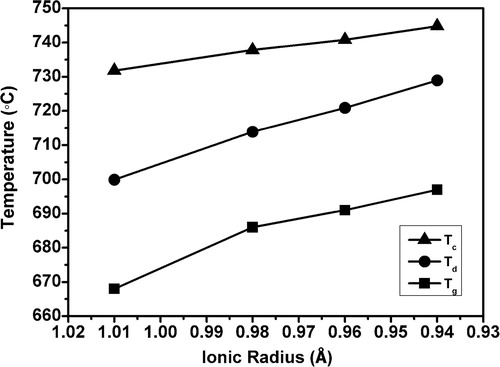
Fig. 4 Variation of density and refractive index as a function of ionic radius of the rare earths added in glass. Inset picture shows the precursor glasses.
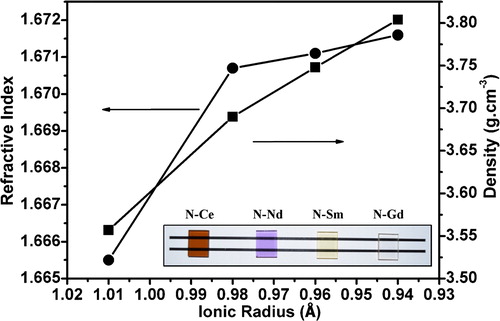
Fig. 5 X-ray patterns of the glasses heat treated at 880 °C for 2 h.
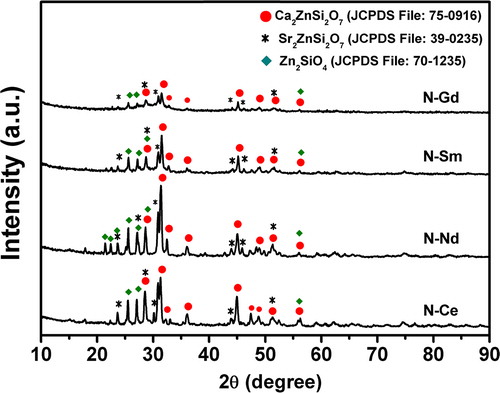
Fig. 6 FESEM photomicrographs of heat treated glass samples (a) N–Ce, (b) N–Nd, (c) N–Sm and (d) N–Gd at 880 °C for 2 h along with their enlarged view under high magnification.
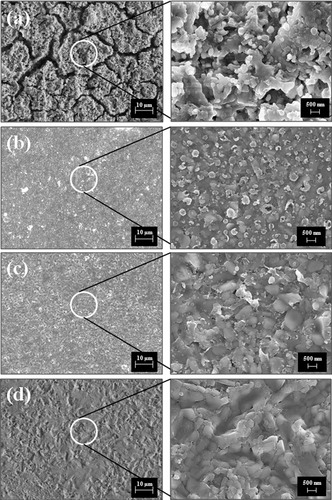
Table 3 FTIR spectral band position and assignment.
Fig. 7 FTIR spectra of (a) precursor glasses and (b) glasses heat treated at 880 °C for 2 h.
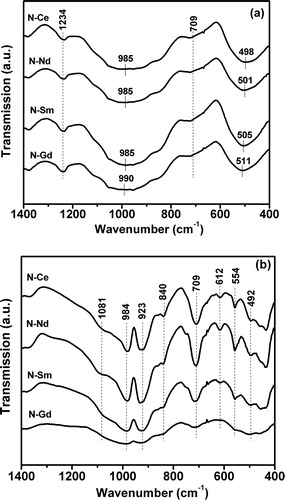
Table 4 Activation energy of crystallization of the glasses evaluated by different models.
Fig. 8 Crystallization kinetics study by Kissinger, Augis–Bennet and Ozawa models of glass samples N–Ce and N–Gd. Lines are obtained by linear fitting of the data.
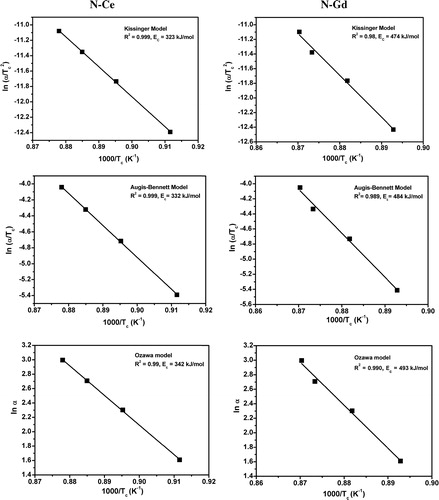
Fig. 9 The XPS survey spectra of all the precursor glass samples.
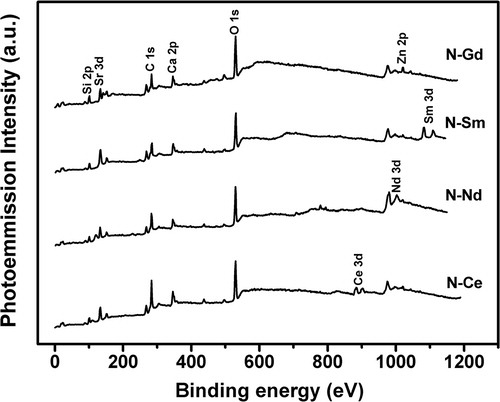
Fig. 10 The XPS core level spectra in the respective precursor glass samples (a) N–Ce, (b) N–Nd, (c) N–Sm and (d) N–Gd.
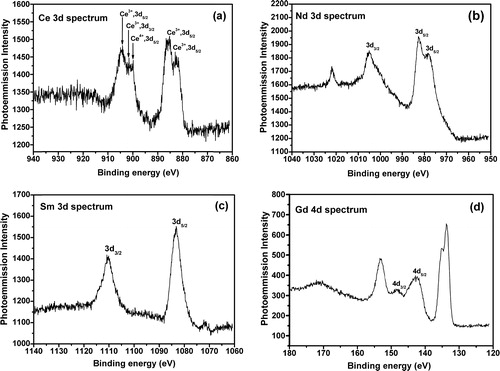
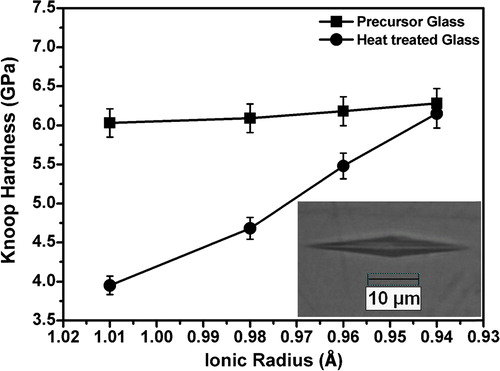
Fig. 11 Variation of hardness of the glasses and the glasses heat treated at 880 °C for 2 h as a function of the ionic radius of the rare earths added in glass. Inset picture is showing representative indentation impression.