Figures & data
Table 1 Chemical formulae obtained by analysis and proposed formulae in good agreement with the model of Iyi ([Li1−xNbx/5(VLi)4x/5] NbO3) [Citation13], with different stoichiometries of LN (where □ denotes the empty Li-site).
Fig. 1 XRD patterns of samples S2 (x = 0.025), S3 (x = 0.045) and SEM micrograph (inset) of sample S2.
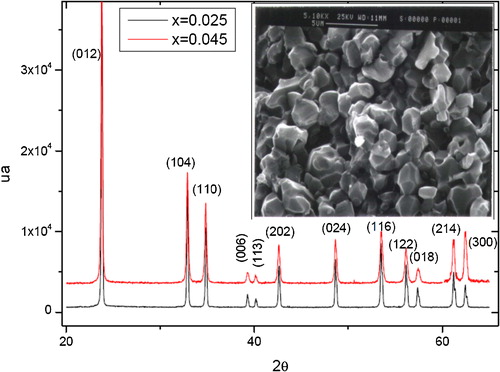
Table 2 Values of cell parameters a, c, ratio c/a and cell volume of samples S1, S2, S3 and S4.
Fig. 2 Equivalent electrical RC circuit for grain, and grain boundary and electrode–electrolyte interface effects.
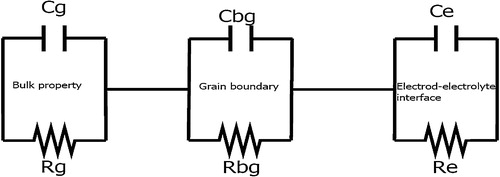
Fig. 3 Variation of Nyquist plots of samples (a) S1, (b) S2 and (c) S4 at different temperatures.
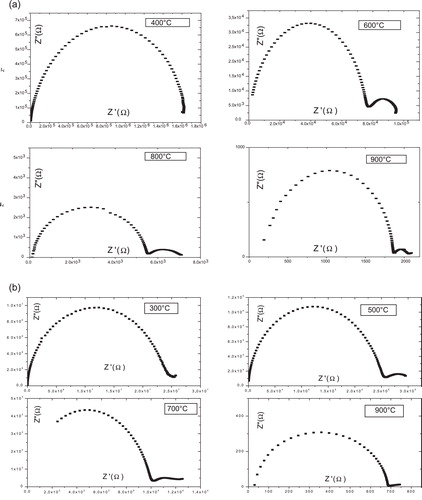
Fig. 3 (Continued).
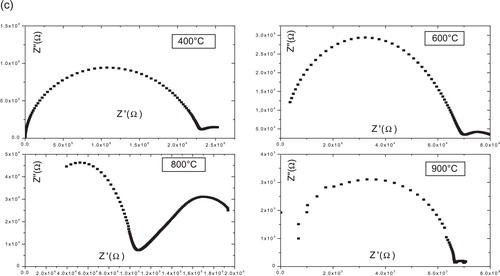
Fig. 4 Ac conductivity as a function of frequency at different temperatures for all samples (a) S1, (b) S2, (c) S3 and (d) S4.
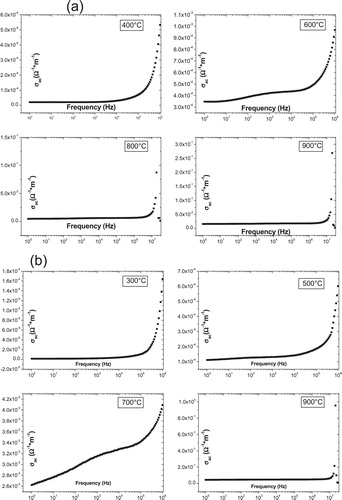
Fig. 4 (Continued).
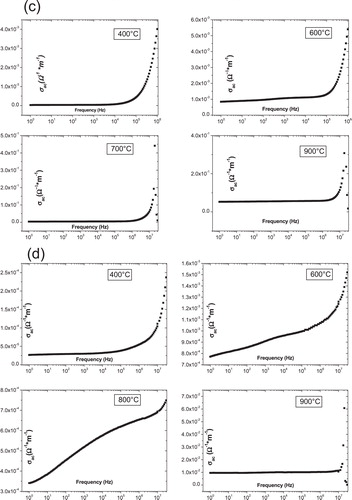
Table 3 Values of critical exponent n1 and n2 for S1, S2, and S3 at different temperatures.
Table 4 Values of Ea (activation energy) and σ0 (pre-exponential factor) before and after the temperature threshold of samples S1, S2, S3 and S4.
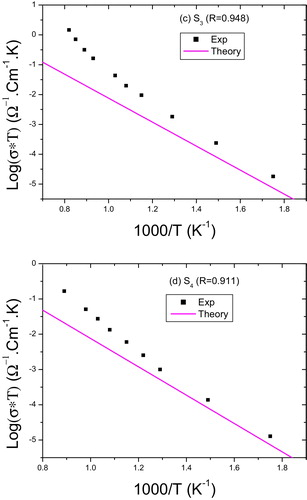
Fig. 5 Variation of static conductivity vs the 1000/T for the samples (a) S1 and (b) S2.
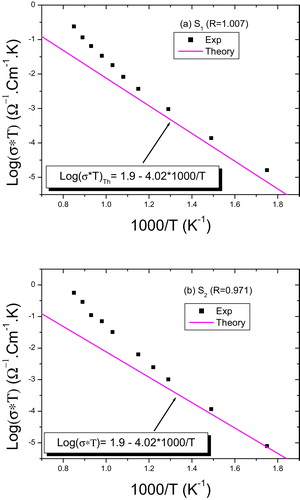
Fig. 6 Variation of static conductivity vs the 1000/T for the samples (c) S3 and (d) S4.