Figures & data
Table 1 Data showing the density, dielectric and piezoelectric properties of (K0.44Na0.52Li0.04)(Nb0.86Ta0.1Sb0.04)O3 ceramics co-doped with different amounts of La and Mn at room temperature.
Fig. 1 Scanning electron microscope images of the thermally etched surfaces of (K0.44Na0.52Li0.04)(Nb0.86Ta0.1Sb0.04)O3 ceramics sintered at 1075 °C for 1 h in air atmosphere showing (a) the undoped ceramic, (b) ceramic with 0.25 mol% of La, Mn and (c) with 0.5 mol% of La, Mn.
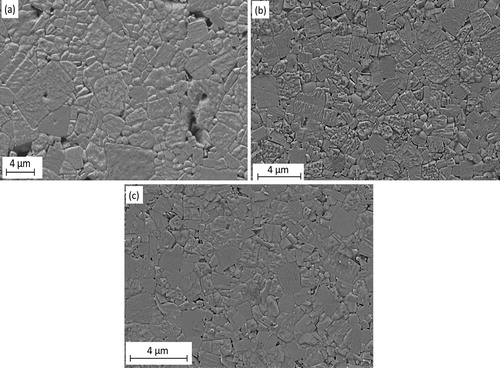
Fig. 2 X-ray diffraction patterns of (K0.44Na0.52Li0.04)(Nb0.86Ta0.1Sb0.04)O3 ceramics doped with different amounts of dopants. Traces of an extra phase can be observed on the pattern containing 1 mol% of La and Mn.
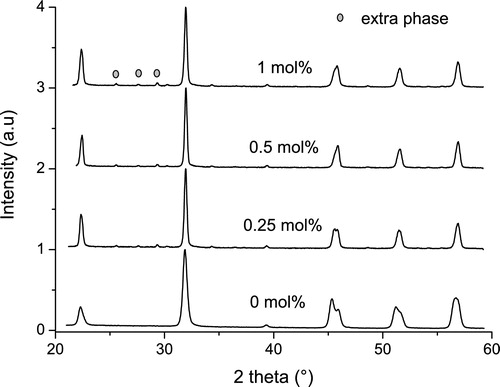
Fig. 3 Temperature dependence of (a) the dielectric constant values for (K0.44Na0.52Li0.04)(Nb0.86Ta0.1Sb0.04)O3 ceramics measured at 1 kHz and (b) the dielectric loss (tan δ) values for (K0.44Na0.52Li0.04)(Nb0.86Ta0.1Sb0.04)O3 ceramics measured at 1 kHz. The inset in the graph magnifies the region of the graph from 20 °C to 250 °C and from 20 °C to 300 °C for (a) and (b), respectively.
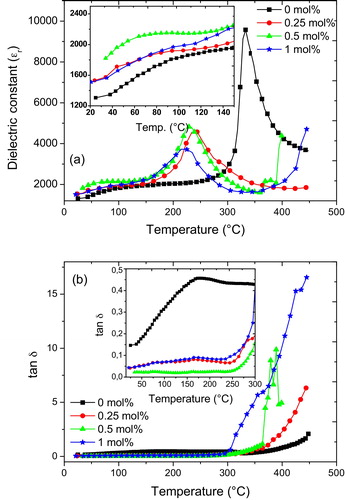
Fig. 4 A plot of the polarisation–electric field hysteresis curves for (K0.44Na0.52Li0.04)(Nb0.86Ta0.1Sb0.04)O3 ceramics co-doped with different amounts of La and Mn.
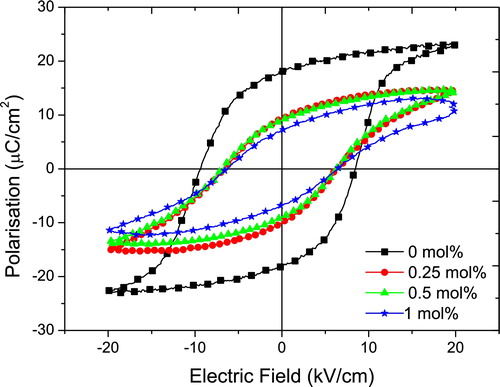
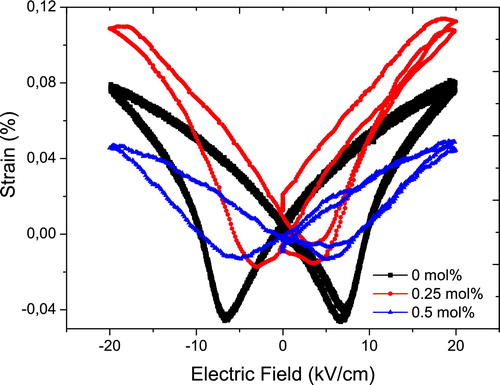
Fig. 5 A plot of the strain–electric field hysteresis curves for (K0.44Na0.52Li0.04)(Nb0.86Ta0.1Sb0.04)O3 ceramics co-doped with different amounts of La and Mn.