Figures & data
Fig. 1 SEM images of fractured surface of as-sintered samples: (a) Ni/Al2O3-044 and (b) Ni/Al2O3-014.
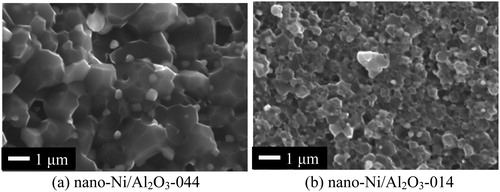
Fig. 2 XRD patterns of nano-Ni/Al2O3: (a) before oxidation, (b) oxidized at 1200 °C for 1 h and (c) oxidized at 1200 °C for 24 h in air.
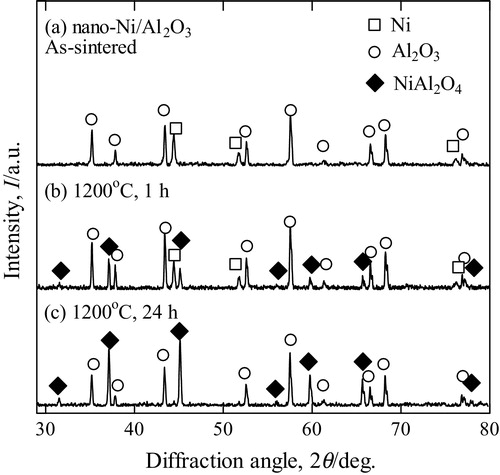
Fig. 3 SEM images of cross-section surface of (a) Ni/Al2O3-014 and (b) Ni/Al2O3-044 sample after oxidation at 1200 °C for 24 h in air. A thin surface layer composed of NiAl2O4 was observed on both samples.
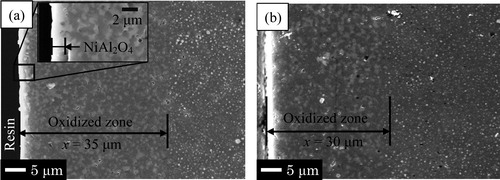
Fig. 4 Thickness of oxidized zone as a function of oxidation time in air at various temperatures.
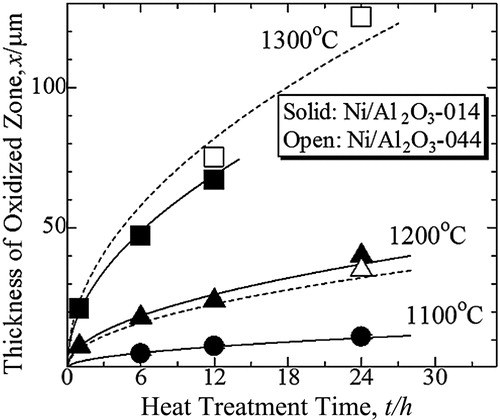
Fig. 5 Temperature dependence of parabolic rate constant on oxidation of Ni/Al2O3-014 and Ni/Al2O3-044.
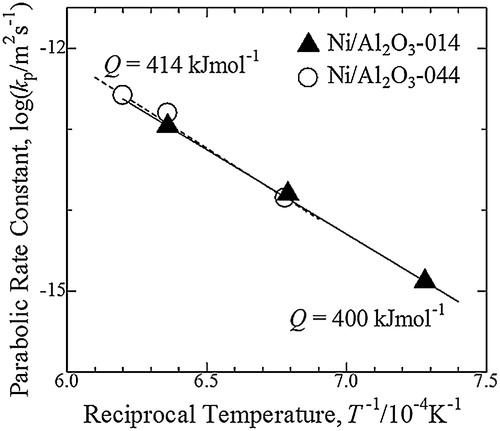
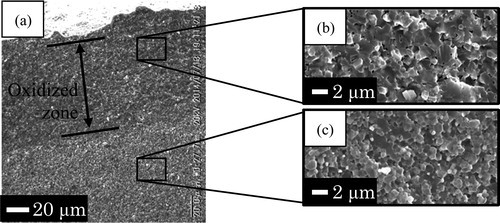
Fig. 6 SEM images of fractured surface of Ni/Al2O3-044 after oxidation at 1300 °C for 12 h.
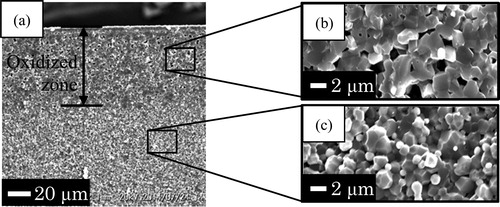
Fig. 7 SEM images of fractured surface of Ni/Al2O3-014 after oxidation at 1300 °C for 12 h.