
Figures & data
Table 1 Glass transition (Tg) and crystallization temperatures (Tc) for glassy Se90Cd10−xInx (x = 2, 4, 6, 8) alloys.
Fig. 1 DSC thermograms for glassy Se90Cd10−xInx (x = 2, 4, 6, 8) alloys at heating rate of 10 K min−1.
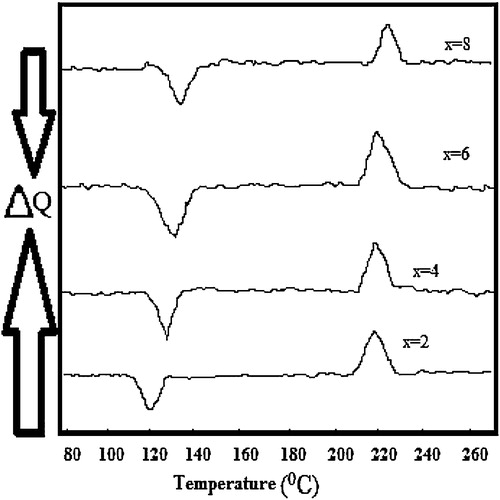
Fig. 2 SEM images of Se90Cd10−xInx glassy alloys at 10,000× magnification [(a) x = 2, (b) x = 4, (c) x = 6 and (d) x = 8].
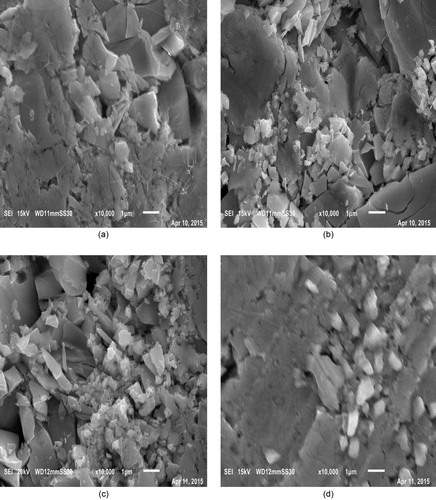
Table 2 The compositional analysis of Se90Cd10−xInx (x = 2, 4, 6, 8) glassy alloys.
Fig. 3 Energy dispersive X-ray analysis EDAX for Se90Cd8In2 glassy alloy.
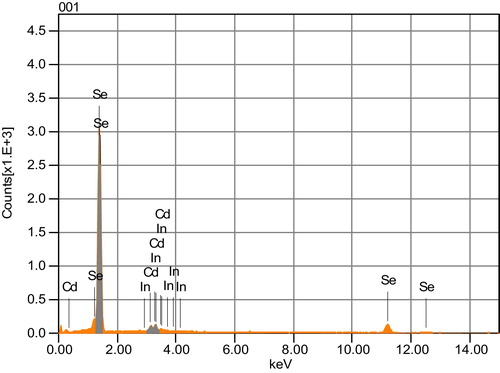
Table 3 Dielectric constant (ɛ′) and Dielectric loss factor (ɛ″) for Se90Cd10−xInx (x = 2, 4, 6, 8) alloys at selected frequencies.
Fig. 4 Variation of real part of dielectric constant with log f.
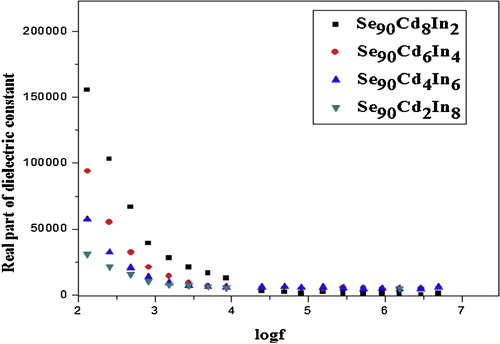
Fig. 5 Variation of dielectric loss with log f.
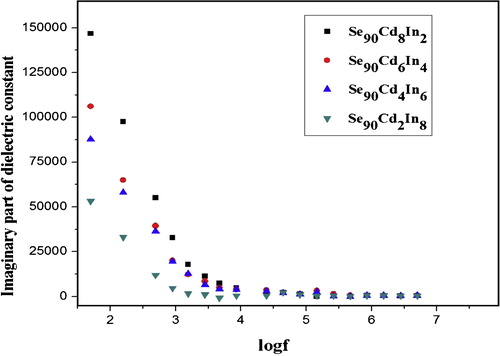
Table 4 Calculated covalent character of bonds for Se90Cd10−xInx (x = 2, 4, 6, 8) glassy alloys.
Fig. 6 Compositional dependence of dielectric constant (ɛ′) in Se90Cd10−xInx glassy alloys.
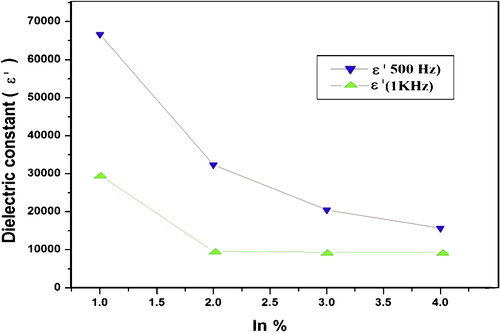
Fig. 7 Compositional dependence of dielectric loss (ɛ″) in Se90Cd10−xInx glassy alloys.
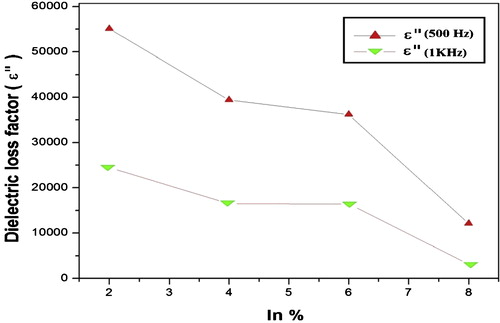
Fig. 8 Variation of loss angle Tan δ with frequency for Se90Cd10−xInx at room temperature for different compositions.

Fig. 9 Variation of AC conductivity with log f.
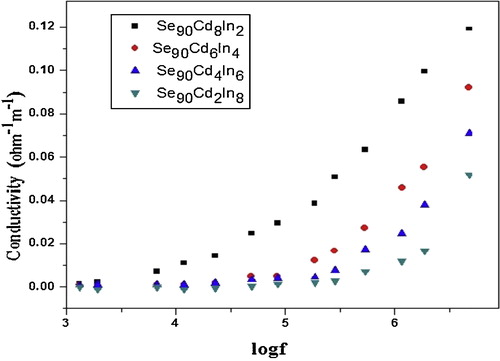
Table 5 Values of AC conductivity σac(ω) for Se90Cd10−xInx (x = 2, 4, 6, 8) alloys at room temperature.
Fig. 10 Cole–Cole plot of Se90Cd10−xInx glassy alloys: (a) x = 2, (b) x = 4, (c) x = 6 and (d) x = 8.
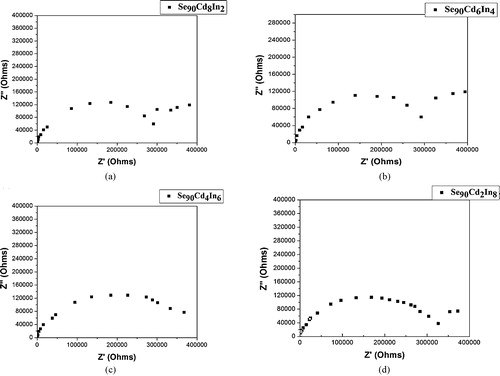
Table 6 Bulk resistance (Rb) of Se90Cd10−xInx (x = 2, 4, 6, 8) glassy alloys.