
Figures & data
Fig. 1 (a–d) Frequency dependent dielectric constant, ɛ′ for glassy Se70Te30 and Se70Te28M2 (M = Ag, Zn, Cd) alloys.
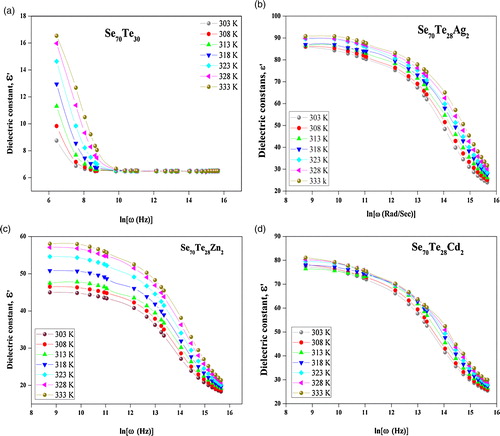
Fig. 2 (a–d) Frequency dependent dielectric loss, ɛ″ for glassy Se70Te30 and Se70Te28M2 (M = Ag, Zn, Cd) alloys.
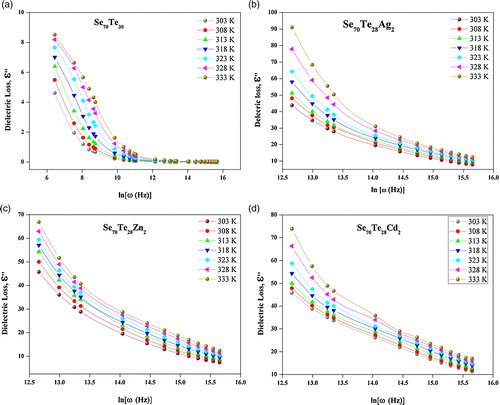
Fig. 3 (a–d) Conductivity, as a function frequency for glassy Se70Te30 and Se70Te28M2 (M = Ag, Zn, Cd) alloys.
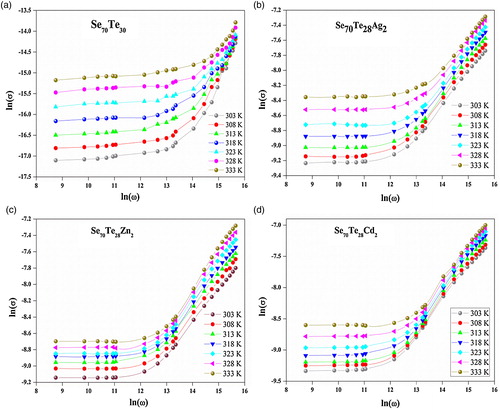
Fig. 4 Frequency exponent, ‘s’ as a function of temperature for glassy Se70Te30 and Se70Te28M2 (M = Ag, Zn, Cd) alloys.
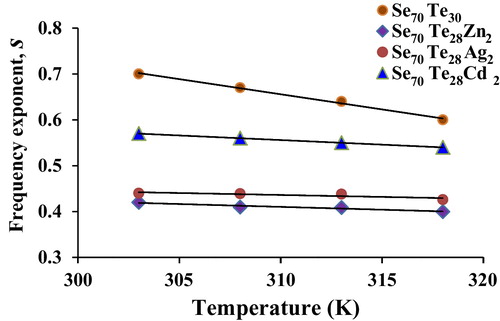
Fig. 5 (a–d) Conductivity, s (S/m) as a function of inverse temperature for glassy Se70Te30 and Se70Te28M2 (M = Ag, Zn, Cd) alloys.
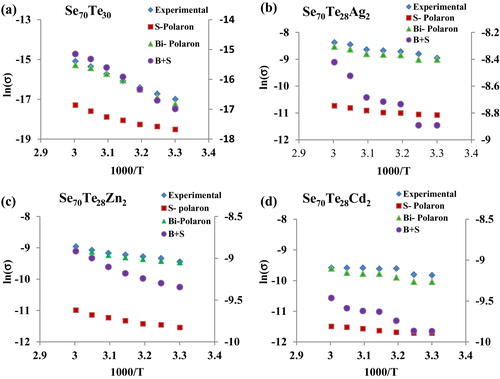
Table 1 Estimated values of density of defect states (DOS) and the distance of inter-site separation (Rω present Se–Te and = Ag, Zn, Cd) alloys.