Figures & data
Table 1 Structural parameters of ZnO doped with different concentrations of alumina.
Fig 1 X-ray diffraction patterns of ZnO doped with (a) 2% Al2O3; (b) 4% Al2O3; (c) 6% Al2O3; (d) 8% Al2O3 and (e) 10% Al2O3.

Table 2 Rietveld refinement results for ZnO doped with different concentrations of alumina.
Fig. 2 Rietveld refinement analysis of XRD patterns of ZnO doped with (a) 2% Al2O3; (b) 4% Al2O3; (c) 6% Al2O3; (d) 8% Al2O3 and (e) 10% Al2O3.
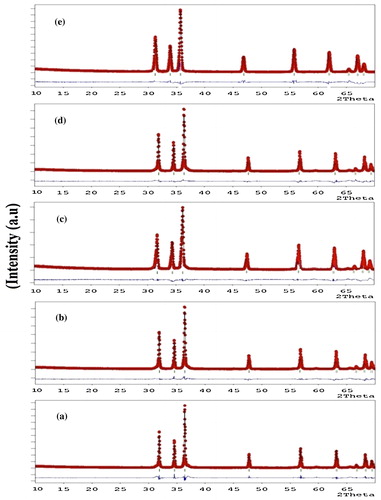
Fig. 3 W–H analysis of ZnO doped with (a) 2% Al2O3; (b) 4% Al2O3; (c) 6% Al2O3; (d) 8% Al2O3 and (e) 10% Al2O3 assuming UDM.
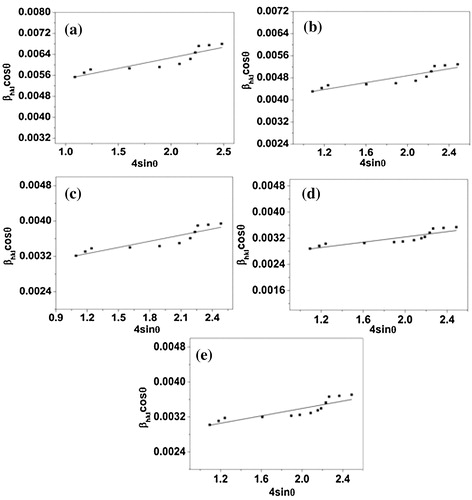
Fig. 4 W–H plots of ZnO doped with (a) 2% Al2O3; (b) 4% Al2O3; (c) 6% Al2O3; (d) 8% Al2O3 and (e) 10% Al2O3 using USDM.

Fig. 5 W–H analysis of ZnO doped with (a) 2% Al2O3; (b) 4% Al2O3; (c) 6% Al2O3; (d) 8% Al2O3 and (e) 10% Al2O3 assuming UDEDM.
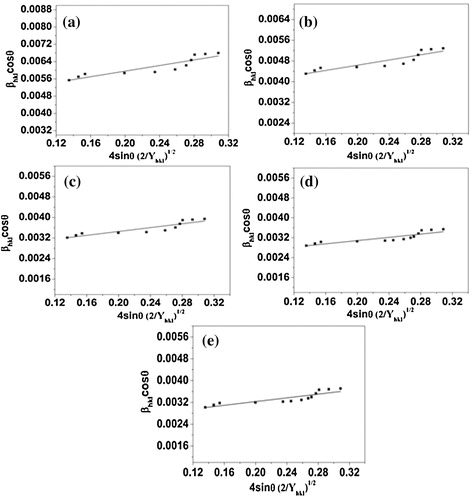
Fig. 6 Plot of (dhkl βhkl cos θhkl)2 versus dhkl2 βhkl cos θhkl.
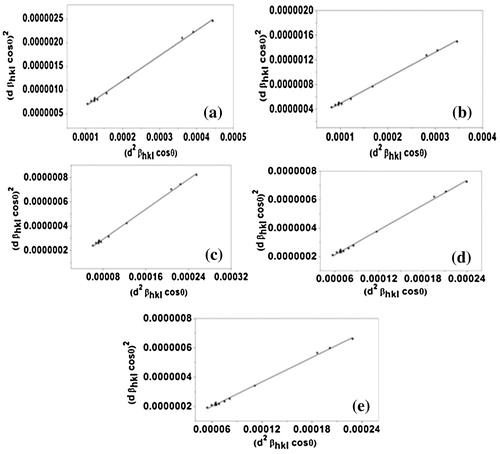
Fig. 7 Variation of crystallite size (D) with alumina concentration obtained from Scherrer method.
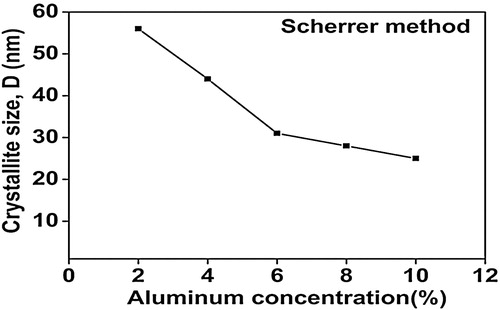
Fig. 8 Variation of D, ε, σ and u with alumina concentration estimated from (a) UDM; (b) USDM; and (c) UDEDM.
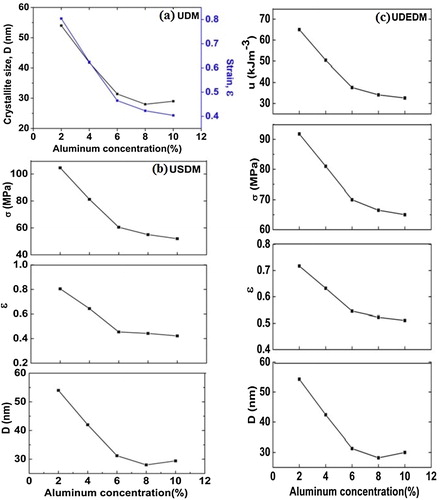
Fig. 9 Variation of crystallite size (D) and strain (ε) with alumina concentration obtained from SSP method.
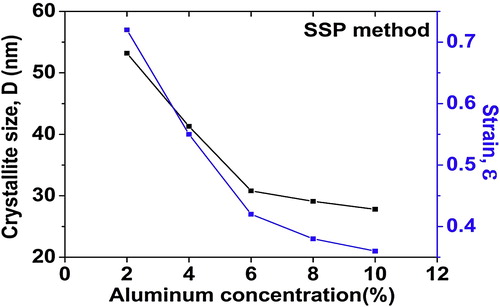
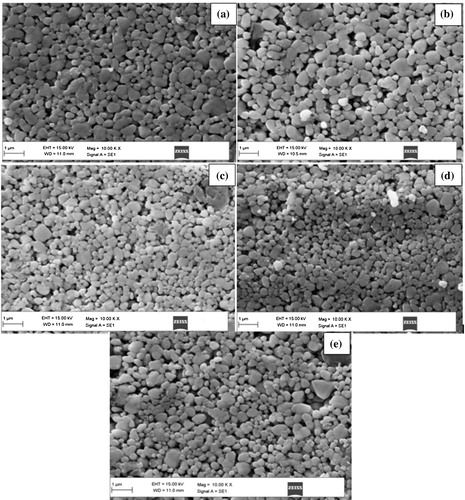
Fig. 10 FESEM images of ZnO doped with (a) 2% Al2O3; (b) 4% Al2O3; (c) 6% Al2O3; (d) 8% Al2O3 and (e) 10% Al2O3.