Figures & data
Figure 1 Altitude profiles of the O+ ion potential energy (ϕ), due to the gravitational force and polarization electric field, for polar wind (solid line) and auroral (dashed line) regions.
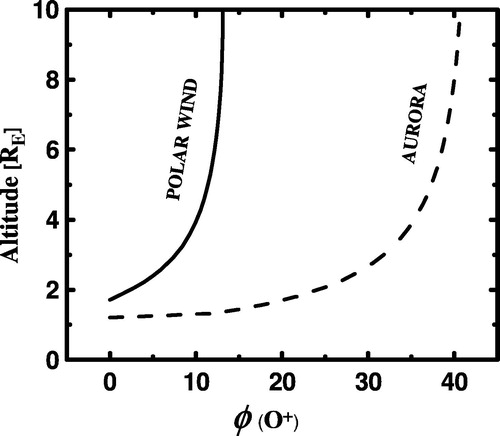
Figure 2 Altitude profiles of the H+ ions potential energy (ϕ), due to the gravitational force and polarization electric field, for polar wind (solid line) and auroral (dashed line) regions.
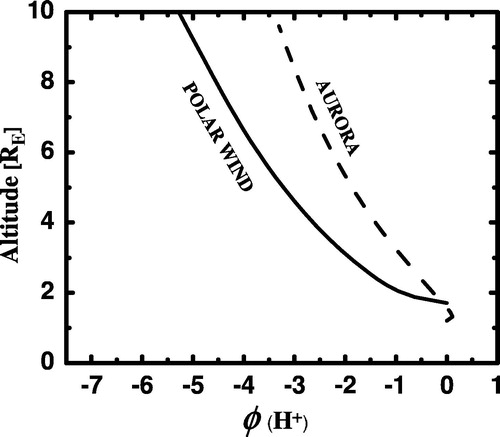
Figure 3 H+ ion velocity distribution functions at different geocentric altitudes in the polar wind (left panel) and auroral (right panel) regions. f(H+) Is represented by equal value contours in the normalized velocity plane, where
. The contour levels decrease successively by a factor e1/2 from the maximum.
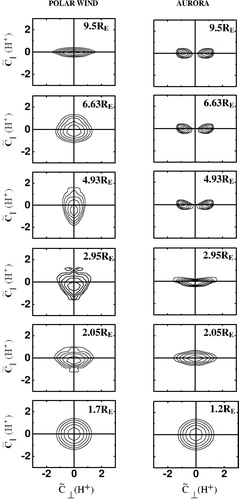
Figure 4 Altitude profiles of H+ ion temperature anisotropy (T⊥/T‖) in the polar wind (solid line) and auroral (dashed line) regions.
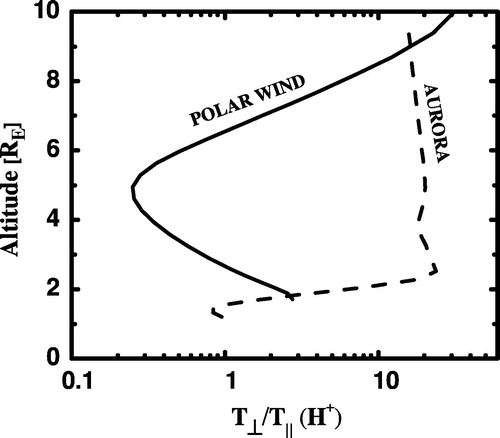
Figure 5 O+ ion velocity distribution functions at different geocentric altitudes in the polar wind (left panel) and auroral (right panel) regions. f(O+) Is represented by equal value contours in the normalized velocity plane, where
. The contour levels decrease successively by a factor e1/2 from the maximum.
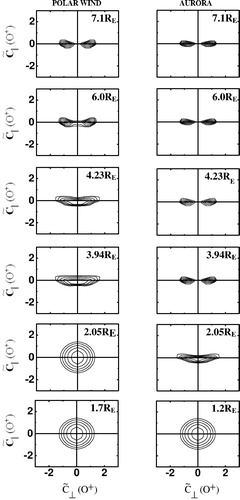
Figure 6 Altitude profiles of O+ ion temperature anisotropy (T⊥/T‖) in the polar wind (solid line) and auroral (dashed line) regions.
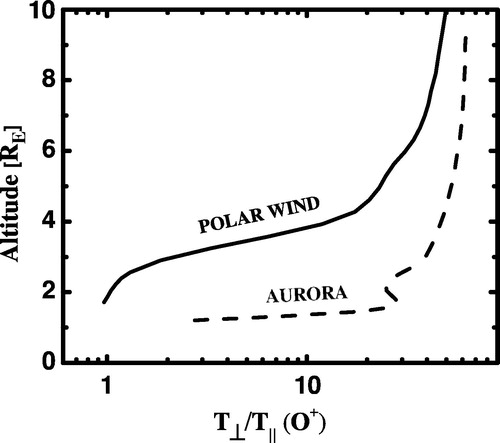
Figure 7 Altitude profiles of the lower order H+ moments for polar wind (solid line) and auroral (dotted line) regions. The moments considered here are: density n[cm−3] (top left), drift velocity u[cm/s] (top right), perpendicular temperature T⊥[k] (bottom left), and parallel temperature T‖[k] (bottom right).
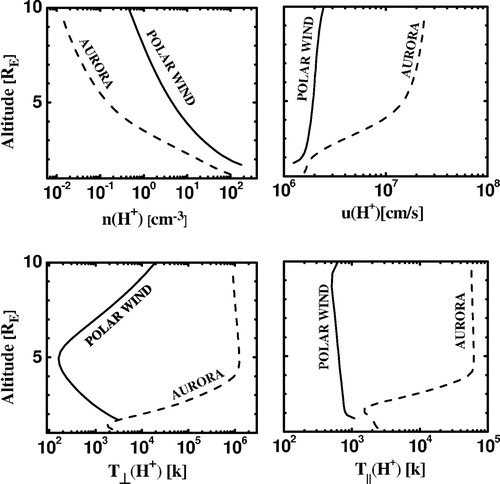
Figure 8 Altitude profiles of the lower order O+ moment for polar wind (solid line) and auroral (dotted line) regions. The moments considered here are: density n[cm−3] (top left), drift velocity u[cm/s] (top right), perpendicular temperature T⊥[k] (bottom left), and parallel temperature T‖[k] (bottom right).
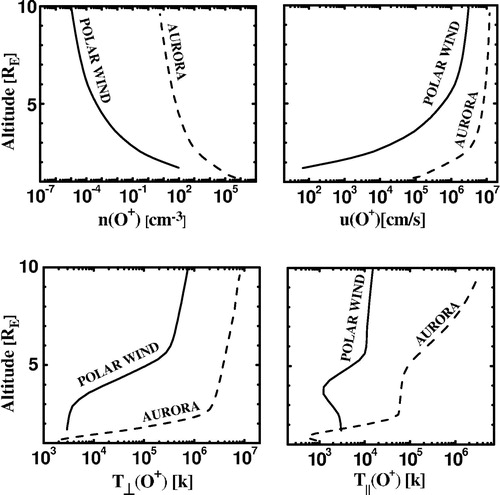
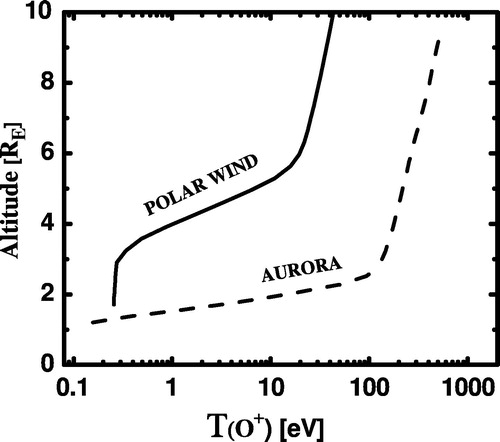
Figure 9 Altitude profiles of H+ ion temperature, for polar wind (solid line) and auroral (dashed line) regions.
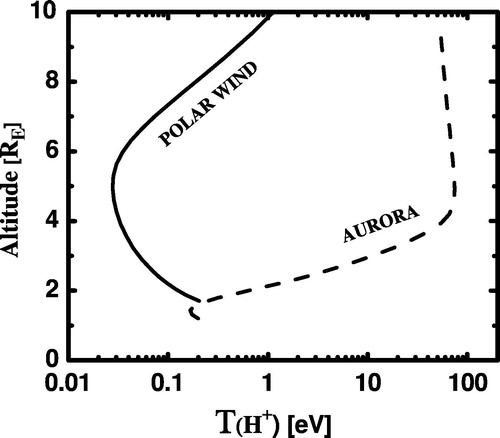
Figure 10 Altitude profiles of O+ ion temperature, for polar wind (solid line) and auroral (dashed line) regions.